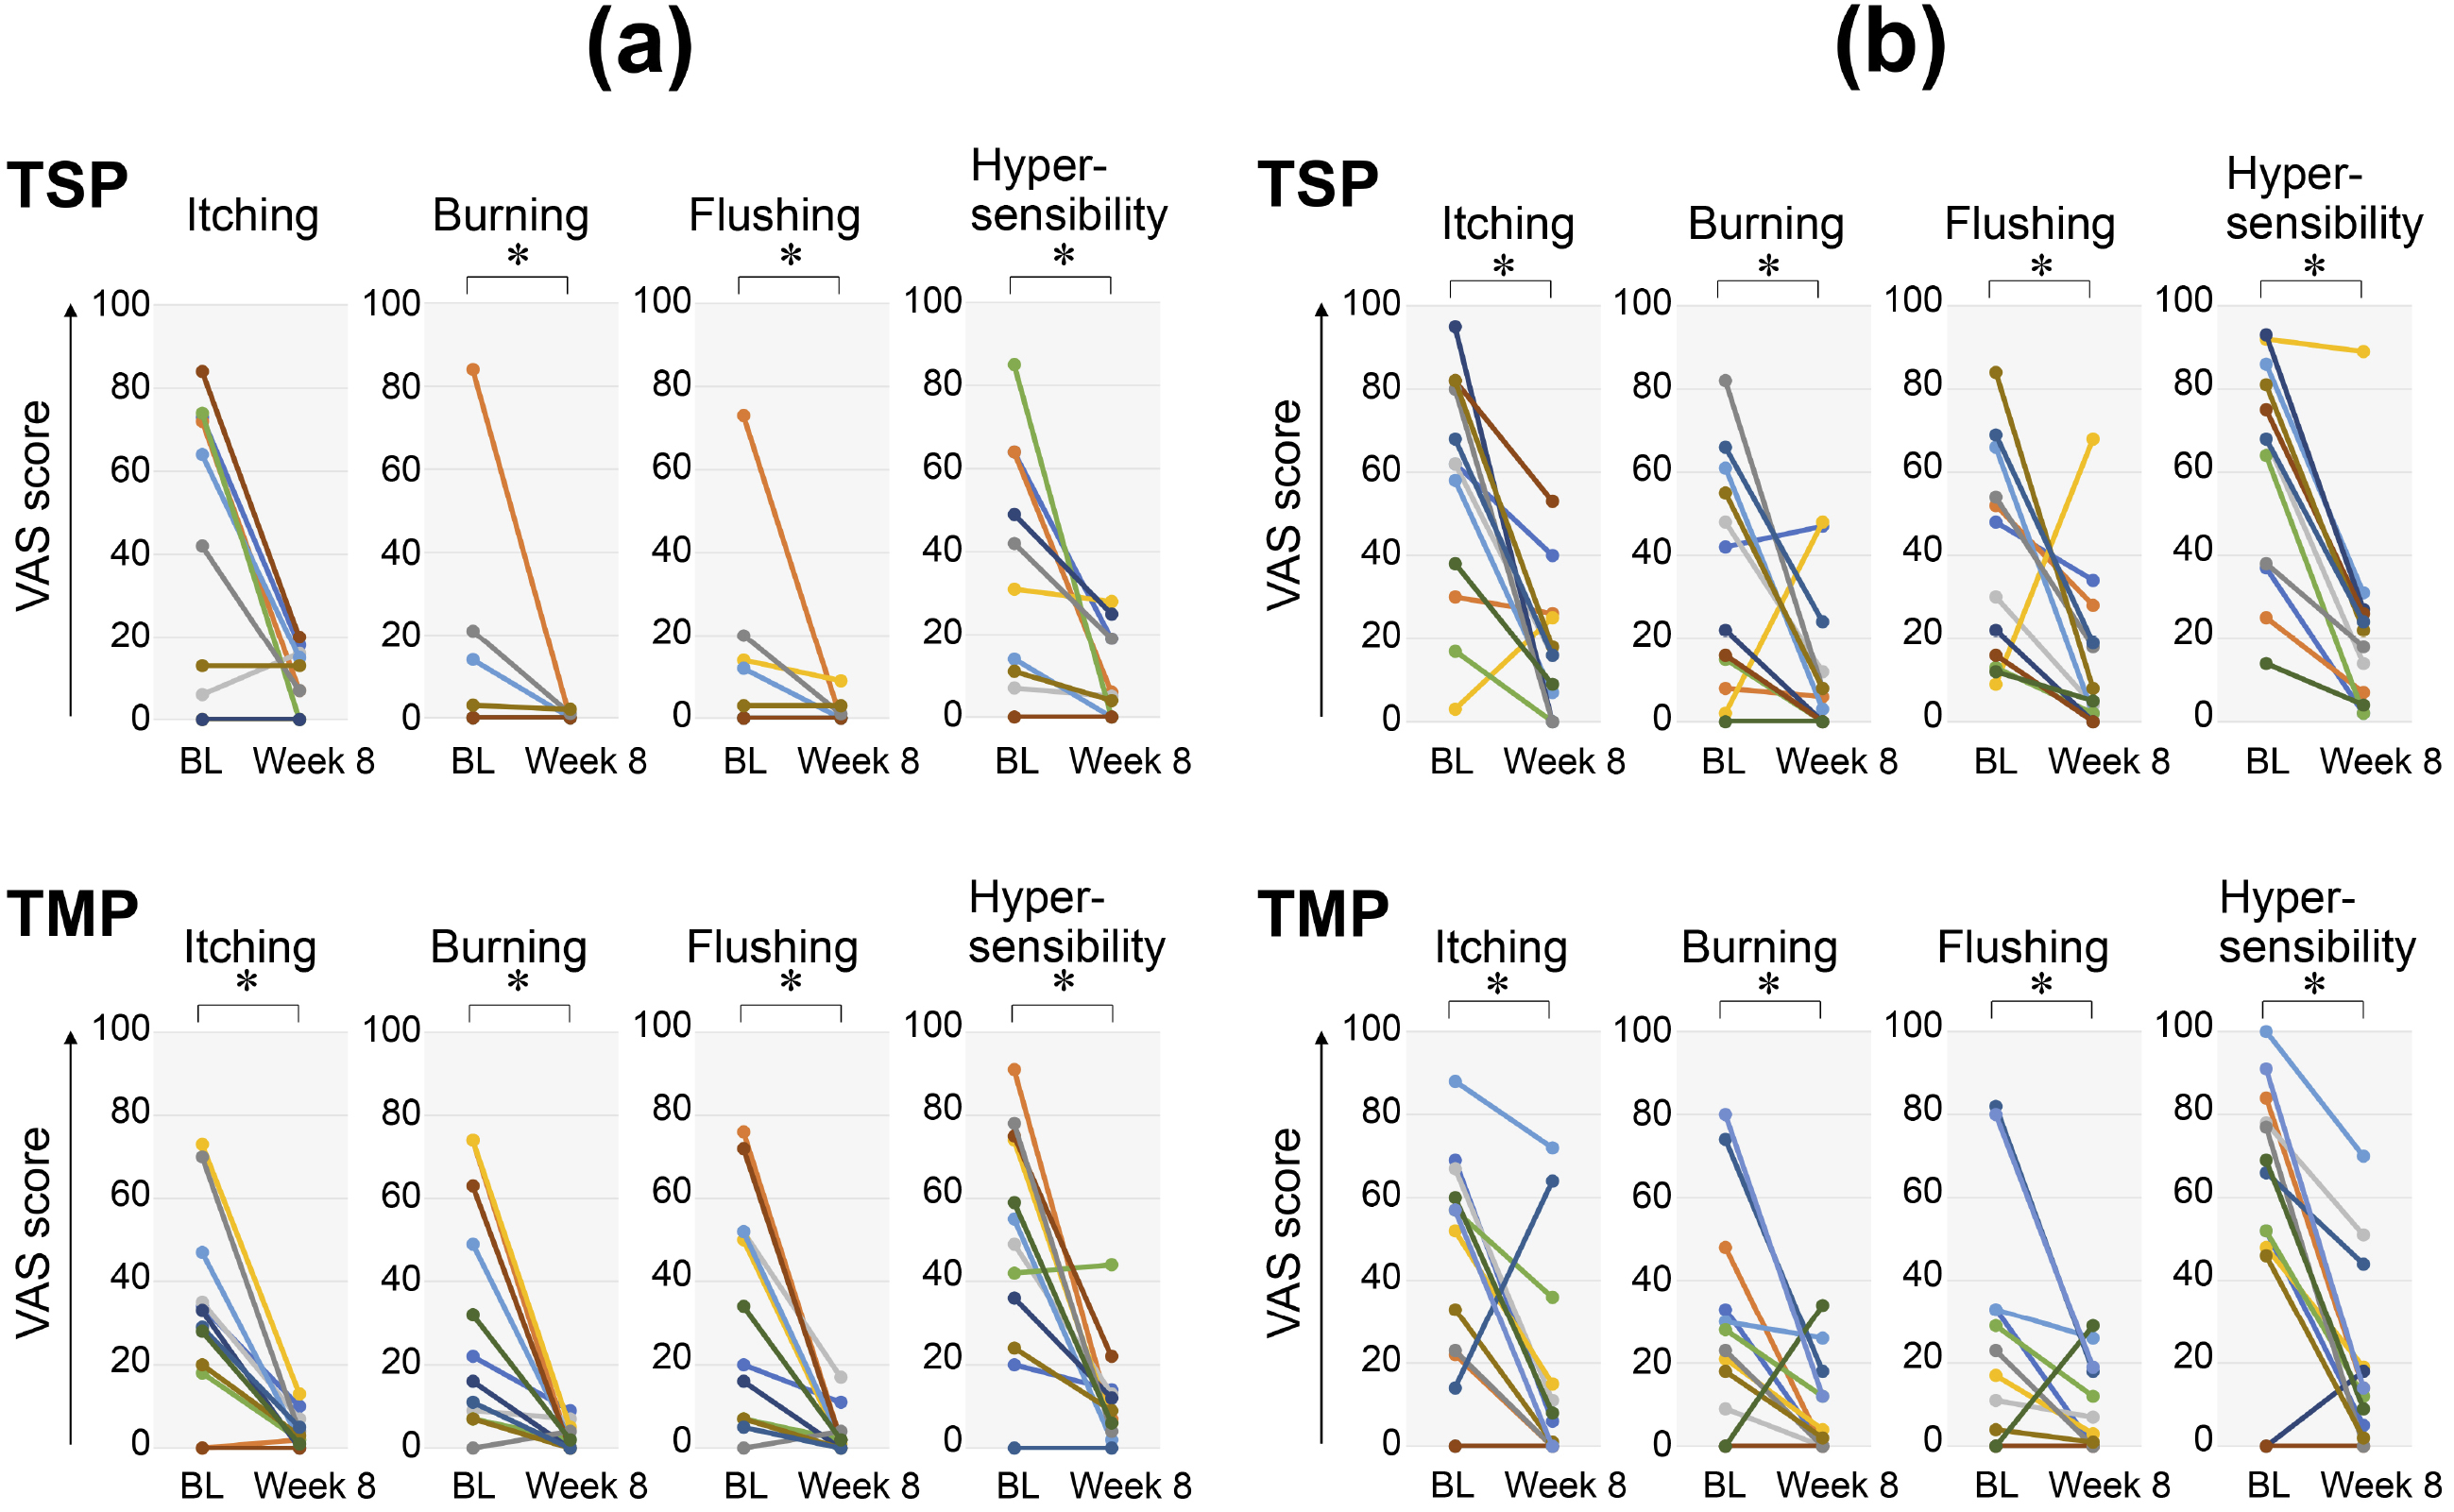
Figure 1. Changes in VAS scores in rosacea patients treated with TSP and TMP
Values examined before and 8 weeks after the initiation of the therapeutic intervention for each patient are plotted. The points indicating values in each patient are connected by a straight line on the graph. Star marks indicate significant differences. BL, baseline before the therapeutic intervention. a) Line graph for patients with ETR. b) Line graph for patients with PPR.
From: Real-world Evidence for the Treatment of Rosacea with Sulfur or Metronidazole Preparation in Japanese Patients