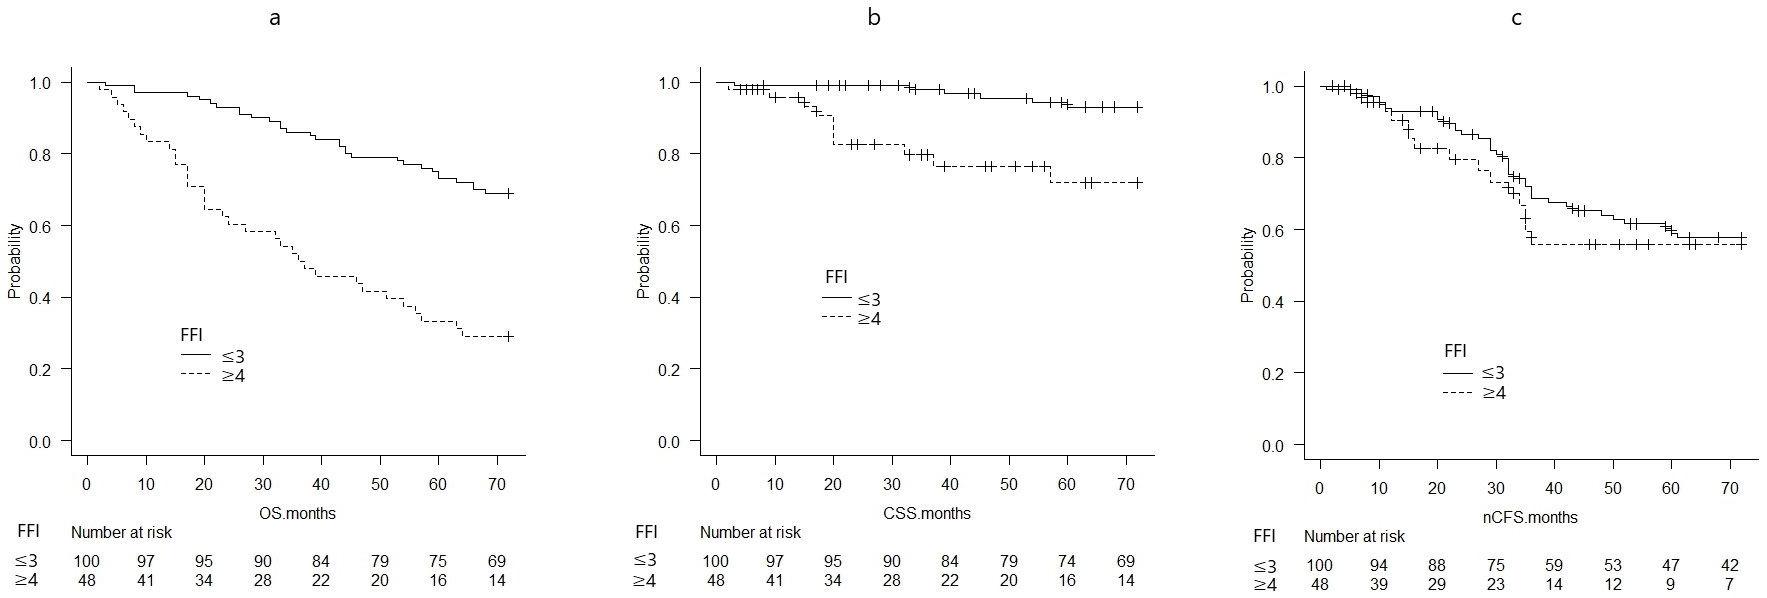
Figure 2. Kaplan-Meier survival curves compared between an FIF of ≤3 and an FIF of ≥4 (a: OS, b: CSS, c: nCFS) Both OS and CSS were significantly different between the two groups with p < 0.01 in the log-rank test. There was no significant difference in nCSF between the two groups in the log-rank test (p = 0.454).