Figure 2. Differences between normal and restricted medical access
The differences between normal and restricted medical access are illustrated for the D-, N-, and B-classifications, type of neurofibroma, site of excised neurofibroma, number of excised neurofibroma, and reason to undergo surgery were illustrated. The horizontal axis indicates the percentage. Cutaneous, cutaneous neurofibroma; No, nodular plexiform neurofibroma; Di, diffuse plexiform neurofibroma.
From: Real-world Settings for the Surgical Treatment of Neurofibroma in Patients with Neurofibromatosis Type 1
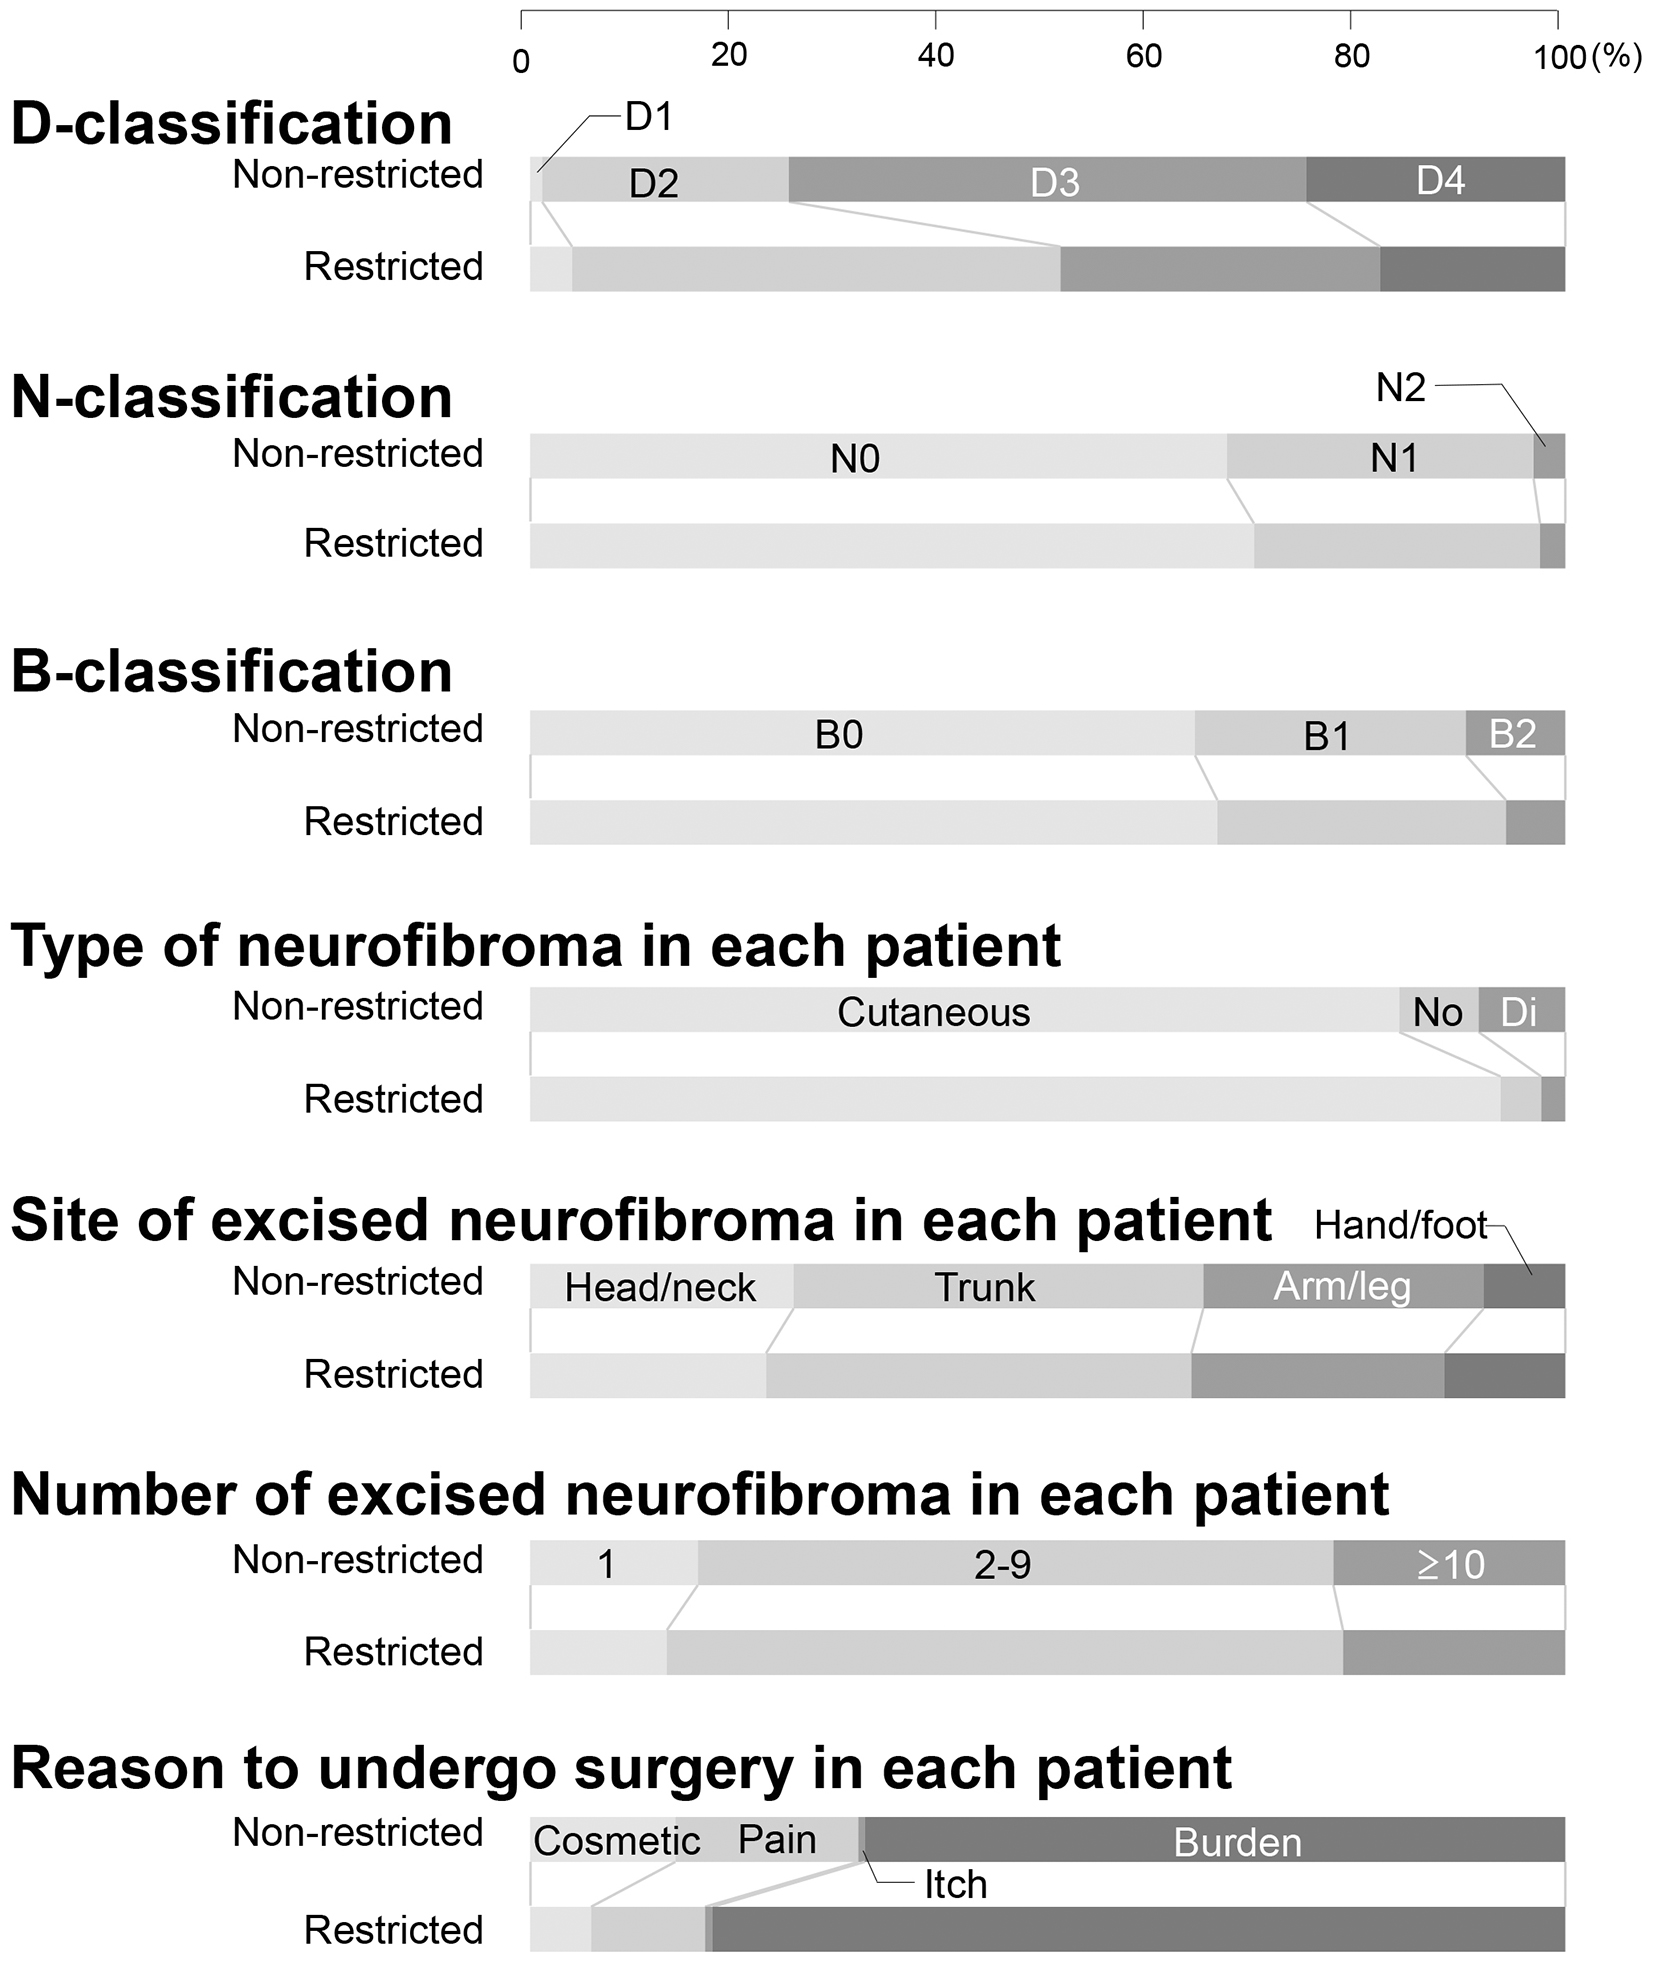
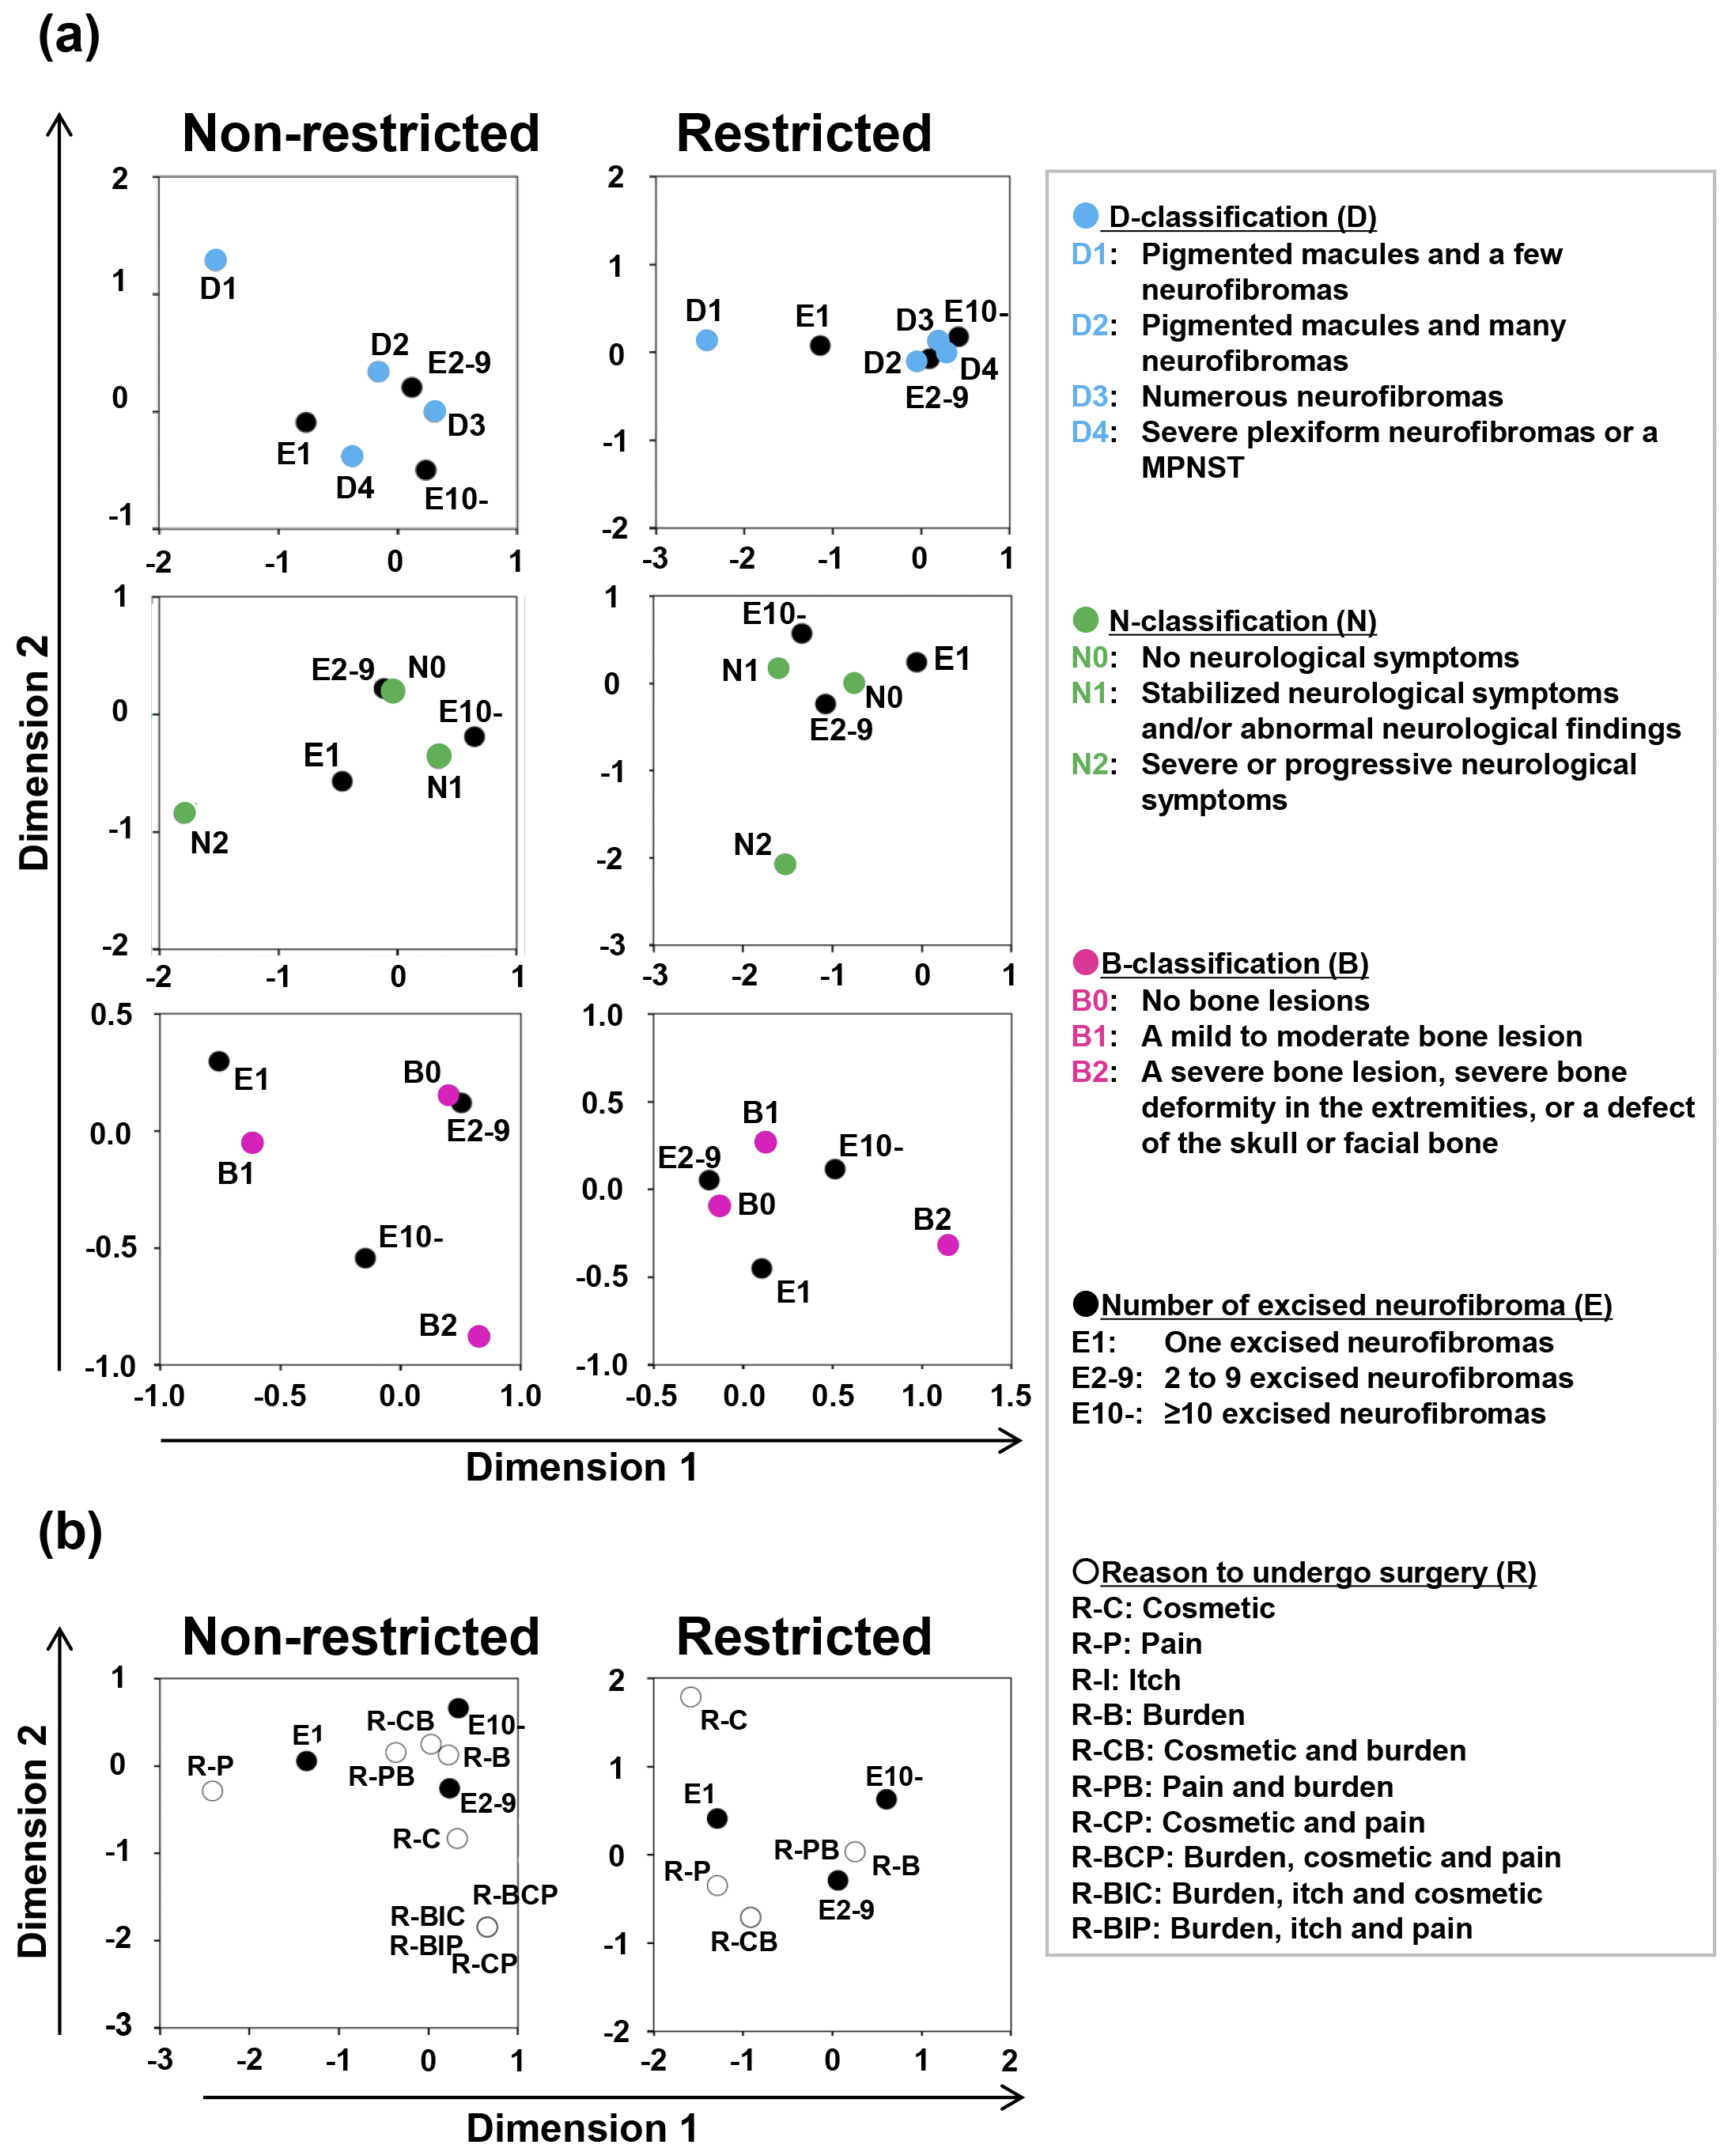
Figure 3. Relationships between the number of excised neurofibromas and severity or reason to undergo surgery
Multiple correspondence analyses showed relationships (a) between the number of excised neurofibromas and D-, N-, or B-classification and (b) between the number of excised neurofibromas and reasons to undergo surgery. The vertical and horizontal axes both indicate dimensions. The closed circles indicate the relative positions of patients who underwent surgery for 1 (E1), 2-9 (E2-9), and ≥10 (E10) neurofibromas. The blue, green, and pink closed circles indicate the relative positions of patients with each D-, N-, and B-classification, respectively. Open circles indicate the relative positions of patients with each reason.
From: Real-world Settings for the Surgical Treatment of Neurofibroma in Patients with Neurofibromatosis Type 1