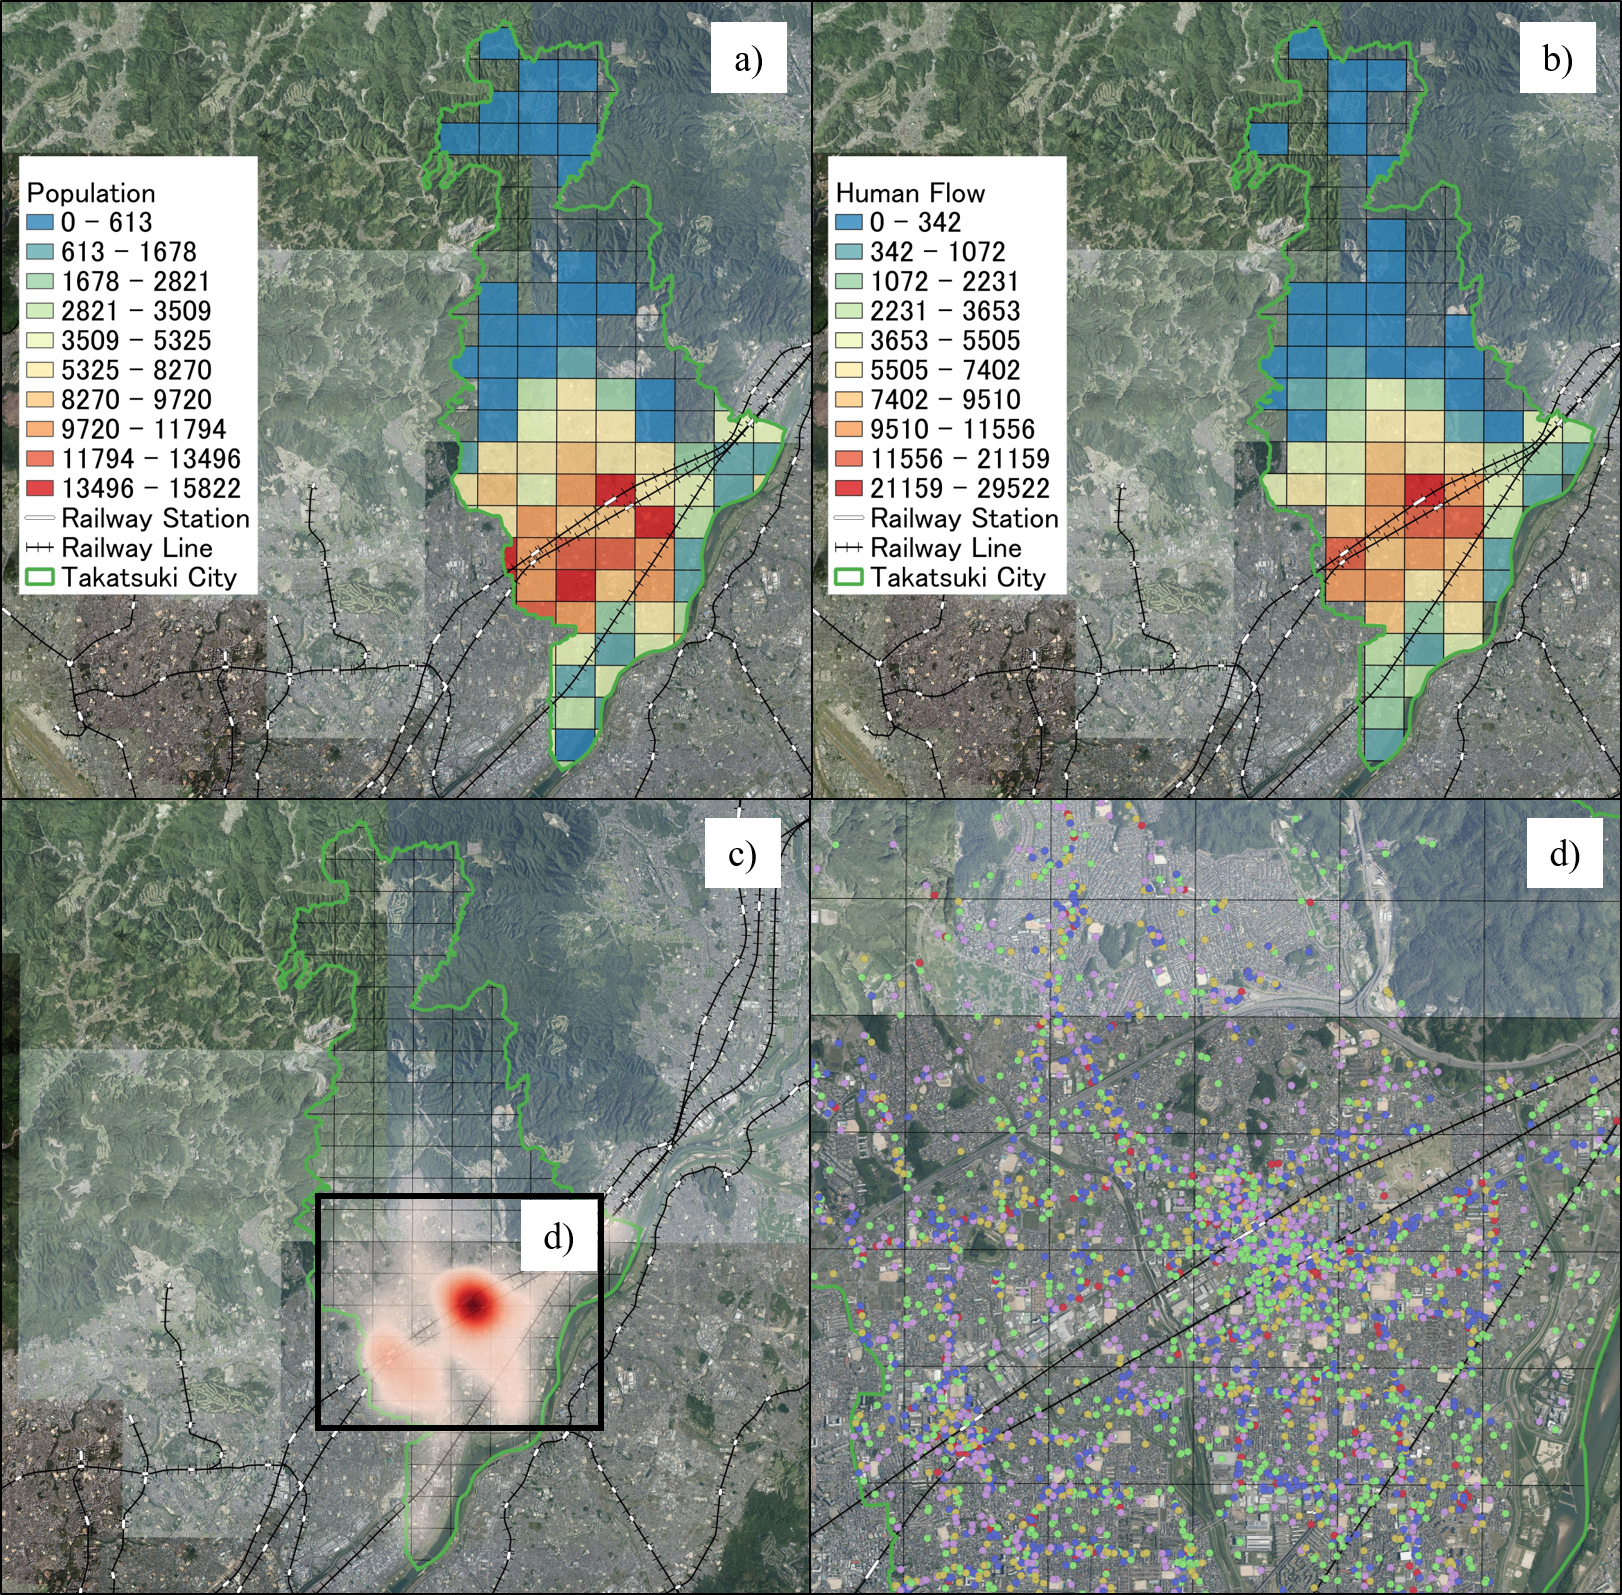
Figure 2. (a) Residential population per mesh (blue = few residents; red = many residents). (b) Human flow per mesh for January 2019 (blue = few residents; red = many residents). (c) Heatmap based on corporate search data demonstrating the distribution of business locations. (d) Business locations in the southern part of the city, where businesses are most densely situated (red: eateries; pink: customer attraction stores; blue: retail stores; green: offices; yellow: medical and care facilities). Each side of all black squares is 1 km. GSI Tile (National Latest Photo [Seamless]) provided by GSI is used as a background map.
From: Using Spatial Scan Statistics and Geographic Information Systems to Detect Monthly Human Mobility Clusters and Analyze Cluster Area Characteristics