Corresponding author: Mitsuro Chiba, mchiba@m2.gyao.ne.jp
DOI: 10.31662/jmaj.2021-0038
Received: March 29, 2021
Accepted: June 2, 2021
Advance Publication: September 27, 2021
Published: October 15, 2021
Cite this article as:
Chiba M, Morita N, Nakamura A, Tsuji K, Harashima E. Increased Incidence of Inflammatory Bowel Disease in Association with Dietary Transition (Westernization) in Japan. JMA J. 2021;4(4):347-357.
Introduction: Inflammatory bowel disease has become a global disease, but its key environmental factors still remain unrecognized. This study aimed to clarify the role of dietary transition (westernization) in the increased incidence of inflammatory bowel disease in Japan.
Methods: Annual numbers of new cases of inflammatory bowel disease in Japan over the period from 1965 to 2000 found in a nationwide database compiled by the government and the daily amount of food and nutrient intake per capita for the same period revealed by the National Nutrition Survey have been used to analyze their interrelation.
Results: Rapid increases in the estimated incidence per 100,000 population have been observed, that is, from 0.08 in 1965 to 4.8 in 2000 for ulcerative colitis and from 0.003 to 1.3 in 2000 for Crohn’s disease, with an extremely high correlation between the annual numbers of new cases of the respective diseases (r = 0.970). Intake of both animal fat and animal protein increased, while intake of rice decreased during the period. Of all food groups, the intake of rice as a staple food showed the highest negative correlation coefficient with the numbers of new cases of both ulcerative colitis (r = -0.825, 95% CI: -0.908 to -0.681, p < 0.0001) and Crohn’s disease (r = -0.836, 95% CI: -0.914 to -0.700, p < 0.0001).
Conclusions: An increased incidence of inflammatory bowel disease was observed to coincide with dietary westernization in Japan. Our results support the assertion that dietary westernization is a key environmental factor in inflammatory bowel disease.
Key words: Crohn’s disease, ulcerative colitis, epidemiology, dietary westernization, environmental factor, inflammatory bowel disease, incidence
Although ulcerative colitis (UC) and Crohn’s disease (CD) form distinct disease entities, they share common features and are collectively referred to as inflammatory bowel disease (IBD). The incidence of IBD in the western world (the USA, Canada, Western Europe, Australia, New Zealand) increased in the latter half of the twentieth century and then plateaued (1). The prevalence of IBD in these countries exceeds 0.3% of the population. On the other hand, the incidence of IBD has been rapidly increasing since the turn of the twenty-first century in newly industrialized countries in Asia, South America, Eastern Europe, and Africa (2). Consequently, IBD is recognized as a global disease (1), (2), (3). Although Japan has the highest prevalence in Asia (UC 219,685, CD 70,700, total population 127.1 million in 2015: prevalence per 100,000 population 172.9 for UC and 55.6 for CD) (4), it is 0.2% of the population. This is less than that of the western world.
The etiology of IBD is unknown, but it is believed to be multifactorial, whereby development of the disease in genetically susceptible subjects is triggered by environmental factors (3). Since IBD is prevalent in developed countries, risk factors in affluent societies have been sought. Formula feeding, oral contraceptives, antibiotics in childhood, air pollution, smoking, appendectomy, improved sanitation, decreased physical activity, increased obesity prevalence, and increased stress level, among others, have been listed as risk factors for IBD. However, none of those has been identified as a key environmental factor. Identification and recognition of key environmental factors are prerequisite for effective treatment and prevention of the disease. It has been anticipated that key environmental factors can be identified through meticulous analysis of environmental factors in areas where the incidence of IBD is growing (5). However, noticeable environmental factors have not been reported in the abovementioned new areas, where the incidence of IBD has rapidly increased since the turn of the twenty-first century (1), (2), (3), (6).
Recent studies in basic medicine have shed light on the interplay between diet, gut microbiota, microbial metabolites, and health/disease (7), (8), (9), (10). They have shown that a gut microbial imbalance (dysbiosis) exists in a variety chronic diseases, including obesity, diabetes mellitus, coronary heart disease, and so on, and that our meals shape gut microbiota. Thus, the role of diet is emphasized more than ever in various common diseases. Gut microbial dysbiosis is consistently observed in IBD (11), implying that improper diet may be involved in onset of IBD.
There have been many ecologic studies, case-control studies, and cohort studies on the relation between diet and IBD (12), (13), (14), (15), (16), (17). They looked at individual nutrients or foods. Some constituents of diets were certainly found to be risk/preventive factor, but results were often inconsistent. Foods influence each other in a complex manner. Therefore, the overall effect of dietary pattern could be more predictive of disease risk (18). The results of dietary pattern were again inconsistent. A Mediterranean diet was associated with a lower risk of later onset of CD but not with UC in a Swedish cohort (19), while no association was found with risk of CD or UC in the European Prospective Investigation into Cancer and Nutrition (EPIC) cohort (20).
Socioeconomic transition toward an affluent society inevitably induces dietary transition (21), (22). In the contemporary era, it is dietary westernization characterized by increased consumption of animal fat, animal protein, and sugar with decreased consumption of carbohydrates (21), (22). For evaluating dietary factors in IBD, it might be more adequate to look at dietary transition as a whole. However, there have been no studies on the relation between dietary transition and the incidence of IBD (14), (15), (16), (17), (18), (19). Japan provides excellent conditions for such a study for several reasons. First, there is a record of nationwide systemic research on the epidemiology of IBD starting in 1965. Second, a national record of IBD registration has been available since 1973. Third, there is a chronological national record of food intake kept by the National Health and Nutrition Survey. Fourth, the Japanese population is rather homogeneous in terms of genes and culture. Fifth, Japan has a high standard of public health and medicine, as shown by its long average life expectancy (23). Sixth, the rate of familial aggregation of IBD is low compared with other countries (24), (25).
Using the above data from between 1966 and 1985 in Japan, Shoda et al. (26) reported that increased intake of animal protein contributed to the increased incidence of CD, but they did not investigate UC.
We hypothesized that there will be a correlation between dietary westernization and an increased incidence of IBD. In order to clarify the role of dietary factors in the increased incidence of IBD, using the earliest Japanese epidemiological data from 1965 to 2000, we investigated the correlation between dietary transition and the number of new cases of IBD and the correlation between CD and UC in the annual numbers of new cases. A part of this study was previously reported (27).
The nationwide epidemiological survey of IBD started in 1965 in Japan. The investigation of the correlation between dietary change and the number of new cases of IBD was designed using the national record of IBD and food intake from 1965 to 2000 in Japan. The investigation of the correlation between CD and UC in the annual numbers of cases was also designed using the national registration record from 1977 to 2000.
The Ministry of Health, Labor and Welfare (formerly the Ministry of Health and Welfare) of Japan designated UC and CD as intractable diseases in 1975 and 1976, respectively. Patients with intractable diseases are provided with public medical aid upon registration at a public health office. Patients diagnosed with IBD are required to submit a registration application form annually to the local government (28). The attending doctor provides detailed information about the patient’s condition on the form. The submitted forms are evaluated by IBD specialists on each prefecture’s committee for IBD. Those who are definitively diagnosed become eligible for registration and for financial medical aid (28). The annual number of registrations is available (29), (30), (31). The number of IBD registrations is estimated to account for about 80% of patients with IBD since some patients with IBD do not apply for the aid because they either do not need it or are not willing to be registered as having an intractable disease (32). The numbers of new cases were arbitrarily defined as the increase in registrations over the preceding year. The annual numbers of new cases since 1965 to the beginning of the national registration were obtained from nationwide hospital-based epidemiological studies conducted by the Research Committee for Intractable Intestinal Diseases, Ministry of Health and Welfare (33), (34).
Data on dietary intake per capita per day were obtained from the National Nutrition Survey reports, except for dietary fiber intake (35). The Ministry of Health, Labor and Welfare has been conducting the National Nutrition Survey every year since 1946. Briefly, approximately 15,000 people from 5,000 families are selected at random among 300 area units nationwide. Staff dietitians from the local public health center visit respondent households for 3 consecutive days, provide guidance on how to fill in the questionnaire, check the records, and correct any inadequacies. The quantity of food intake is calculated from the recorded dietary intake, and then the quantity of nutrient intake is calculated from the quantity of food intake based on food composition tables (35). The National Nutrition Survey covers 15 food groups and several nutrients (35). Data on dietary fiber intake per capita were obtained from the intake of grain, vegetables and mushrooms, beans, fruits, potatoes, seaweed, and confectionaries as described in a previous report by two of the authors (K.T., E.H.) and colleagues (36).
The interrelationships between the annual numbers of new cases and cases of UC and CD from 1977 to 2000 were determined using multiple Pearson product-moment correlation coefficients and were fitted to a linear approximation. Interrelationships between food/nutrient intakes and the numbers of new IBD cases from 1965 to 2000 were determined using multiple Pearson product-moment correlation coefficients. Multiple correlation and multiple regression analyses were done between food intakes and the numbers of new IBD cases. Factor analysis was performed among six nutrients and energy and the numbers of new IBD cases, by extraction of the principal component followed by the Varimax rotation. All tests were two-tailed; a P value of 0.05 or less was considered to indicate a statistically significant difference. Statistical analyses were performed using SPSS for Windows v10.0.7J (SPSS Japan Inc. Tokyo, Japan) on Windows 2000 OS using a Sony VAIO computer (Sony Corp., Tokyo, Japan) and StatView v4.5 (Abacus Concepts Inc., Berkeley, CA, USA) using a Macintosh PowerBook G3 Series computer (Apple Computer, Inc., Cupertino, CA, USA).
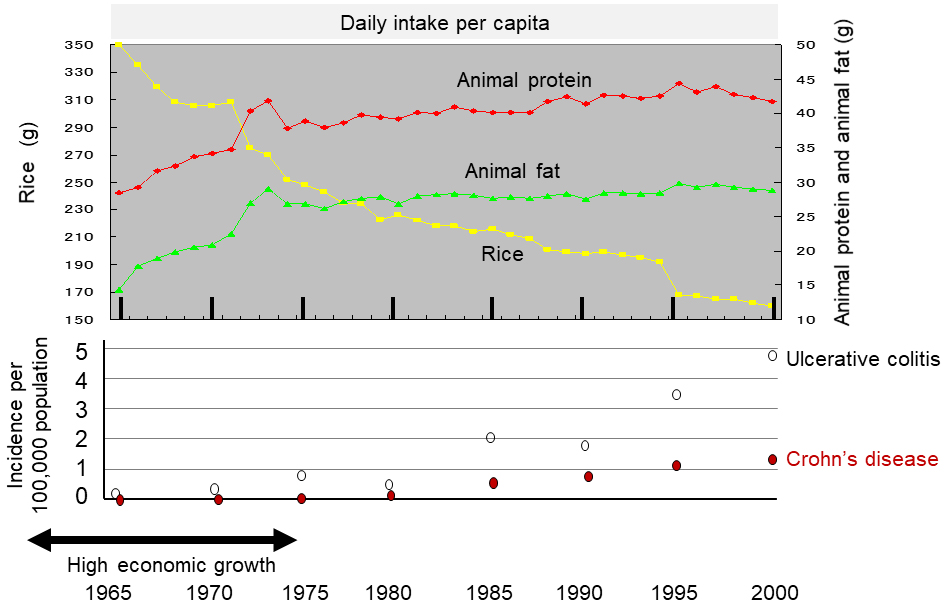
Table 1 summarizes the number of IBD patients every 5 years between 1965 and 2000. There were 79 new cases of UC and 3 cases of CD in 1965, while there were 6083 new cases of UC and 1615 cases of CD in 2000 (Table 1). The estimated incidence of IBD per 100,000 population in 1965 and 2000 was 0.08 and 4.8, respectively, for UC, and 0.003 and 1.3, respectively, for CD (Table 1 and Figure 1). They represent a 60-fold and 433-fold increase in the estimated incidence of UC and CD, respectively, after 35 years. In 2000, there were 66,714 patients with UC and 19,651 patients with CD (Table 1).
Table 1. Number of Patients with Inflammatory Bowel Disease and Dietary Intake in Japan.
| 1965 | 1970 | 1975 | 1980 | 1985 | 1990 | 1995 | 2000 | |
|---|---|---|---|---|---|---|---|---|
| Number of new cases | ||||||||
| Ulcerative colitis | 79 | 256 | 965 | 432 | 2490 | 2387 | 4264 | 6083 |
| Crohn’s disease | 3 | 12 | 82 | 122 | 656 | 894 | 1308 | 1615 |
| Number of patients | ||||||||
| Ulcerative colitis | 965 | 4405 | 11602 | 23200 | 41243 | 66714 | ||
| Crohn’s disease | 128* | 672 | 2831 | 6694 | 12645 | 19651 | ||
| Total population by census (million) | 98.3 | 103.7 | 111.9 | 117.1 | 121.0 | 123.6 | 125.6 | 127.0 |
| Estimated incidence per 100,000 | ||||||||
| Ulcerative colitis | 0.08 | 0.25 | 0.9 | 0.4 | 2.1 | 1.9 | 3.4 | 4.8 |
| Crohn’s disease | 0.003 | 0.01 | 0.07 | 0.1 | 0.5 | 0.7 | 1.0 | 1.3 |
| Food groups intake per capita/day | ||||||||
| Rice (g) | 350 | 306 | 248 | 226 | 216 | 198 | 168 | 160 |
| Wheat (g) | 60.4 | 64.8 | 90.2 | 91.8 | 91.3 | 84.8 | 93.7 | 94.3 |
| Potatoes (g) | 41.9 | 37.8 | 60.9 | 63.4 | 63.2 | 65.3 | 68.9 | 64.7 |
| Sugars (g) | 17.9 | 19.7 | 14.6 | 12.0 | 11.2 | 10.6 | 9.9 | 9.3 |
| Confectioneries (g) | 31.6 | 36.7 | 29.0 | 25.0 | 22.8 | 20.3 | 26.8 | 22.2 |
| Fats & oils (g) | 10.2 | 15.6 | 15.8 | 16.9 | 17.7 | 17.6 | 17.3 | 16.4 |
| Beans (g) | 69.6 | 71.2 | 70.0 | 65.4 | 66.6 | 68.5 | 70.0 | 70.2 |
| Fruits (g) | 58.8 | 81.0 | 193.5 | 155.2 | 140.6 | 124.8 | 133.0 | 117.4 |
| Vegetables & mushrooms (g) | 219.4 | 249.3 | 246.7 | 251.4 | 261.7 | 250.3 | 290.2 | 276.0 |
| Seaweeds (g) | 6.1 | 6.9 | 4.9 | 5.1 | 5.6 | 6.1 | 5.3 | 5.5 |
| Beverages (g) | 119.4 | 163.4 | 148.4 | 134.7 | 136.1 | 137.4 | 190.2 | 182.3 |
| Fishes & shellfishes (g) | 76.3 | 87.4 | 94.0 | 92.5 | 90.0 | 95.3 | 96.9 | 92.0 |
| Meats (g) | 29.5 | 42.5 | 64.2 | 67.9 | 71.7 | 71.2 | 82.3 | 78.2 |
| Eggs (g) | 35.2 | 41.2 | 41.5 | 37.7 | 40.3 | 42.3 | 42.1 | 39.7 |
| Milk & dairy products (g) | 57.4 | 78.8 | 103.5 | 115.2 | 116.7 | 130.1 | 144.4 | 127.6 |
| Energy (kcal) | 2184 | 2210 | 2188 | 2084 | 2088 | 2026 | 2042 | 1948 |
| Nutrient intake per capita/day | ||||||||
| Carbohydrate (g) | 384 | 368 | 337 | 313 | 298 | 287 | 280 | 266 |
| Protein (g) | 71.3 | 77.6 | 81.0 | 78.7 | 79.0 | 78.7 | 81.5 | 77.7 |
| Fat (g) | 36.0 | 46.5 | 52.0 | 52.4 | 56.9 | 56.9 | 59.9 | 57.4 |
| Dietary fiber (g) | 15.7 | 16.3 | 16.5 | 15.7 | 15.8 | 15.2 | 15.9 | 15.7 |
| Animal protein (g) | 28.5 | 34.2 | 38.9 | 39.2 | 40.1 | 41.0 | 43.9 | 41.7 |
| Animal fat (g) | 14.3 | 20.9 | 26.9 | 26.9 | 27.6 | 27.5 | 29.8 | 28.8 |
| *The registration of Crohn’s disease started in 1976. The figure in 1976 is presented. | ||||||||
An extremely high correlation was observed between UC and CD in the annual numbers of new cases (r = 0.970, 95% CI: 0.931-0.987, p <0.0001) and the annual numbers of cases (r = 0.999, 95% CI: 0.999-1.000, p <0.0001) (Figure 2).
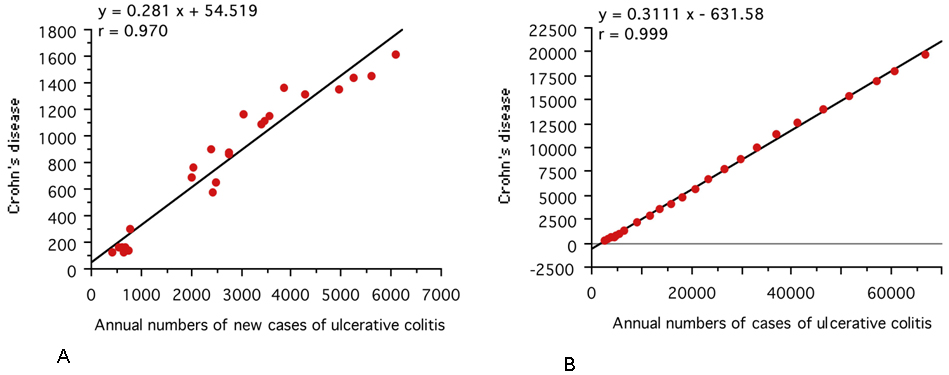
Table 1 summarizes the daily dietary intake for all 15 food groups, 6 nutrients (carbohydrates, protein, fat, dietary fiber, animal protein, and animal fat), and energy every 5 years between 1965 and 2000. Intake of total energy, sugars, and confectioneries peaked around 1970 and then started to decrease (Table 1). Intake of both animal fat and animal protein increased, while intake of rice decreased. These changes occurred drastically from 1965 to 1973 (Figure 1). Thereafter, increased intake of animal fat and animal protein was slight, but a decrease in rice intake occurred at a similar pace for 35 years (Table 1 and Figure 1).
Correlations of different strengths can be identified among the 15 food groups, energy, and 6 nutrients (Table 2). Rice intake decreased year by year and was strongly negatively correlated to intake of milk and dairy products (r = -0.974, 95% CI: -0.987 to -0.949, p < 0.0001), meats (r = -0.926, 95% CI: -0.962 to -0.85, p < 0.0001), animal protein (r = -0.924, 95% CI: -0.961 to -0.854, p < 0.0001), and animal fat (r = -0.897, 95% CI: -0.947 to -0.806, p < 0.0001) (Table 2).
Table 2. Simple Correlation Coefficients and Their P Values among Nutritional Variables and Inflammatory Bowel Disease.
| Ri | Wh | Po | Su | Co | FO | Be | Fr | VM | SW | Bev | FS | Me | Eg | MD | En | CH | P | F | DF | AP | AF | UC | CD | |
|---|---|---|---|---|---|---|---|---|---|---|---|---|---|---|---|---|---|---|---|---|---|---|---|---|
| Ri | 1.000 | -0.795 | -0.805 | 0.895 | 0.761 | -0.722 | 0.267 | -0.250 | -0.578 | 0.164 | -0.406 | -0.833 | -0.926 | -0.540 | -0.974 | 0.880 | 0.985 | -0.522 | -0.927 | 0.525 | -0.924 | -0.897 | -0.825 | -0.836 |
| Wh | **** | 1.000 | 0.759 | -0.767 | -0.630 | 0.652 | -0.546 | 0.723 | 0.584 | -0.554 | 0.127 | 0.693 | 0.896 | 0.319 | 0.781 | -0.522 | -0.764 | 0.683 | 0.871 | -0.129 | 0.819 | 0.904 | 0.426 | 0.405 |
| Po | **** | **** | 1.000 | -0.855 | -0.846 | 0.483 | -0.135 | 0.392 | 0.372 | -0.497 | -0.034 | 0.687 | 0.759 | 0.206 | 0.737 | -0.756 | -0.822 | 0.364 | 0.737 | -0.363 | 0.693 | 0.714 | 0.618 | 0.631 |
| Su | **** | **** | **** | 1.000 | 0.866 | -0.518 | 0.402 | -0.267 | -0.436 | 0.391 | -0.124 | -0.808 | -0.893 | -0.359 | -0.870 | 0.825 | 0.923 | -0.476 | -0.805 | 0.540 | -0.866 | -0.824 | -0.753 | -0.787 |
| Co | **** | **** | **** | **** | 1.000 | -0.534 | 0.281 | -0.169 | -0.118 | 0.281 | 0.186 | -0.592 | -0.673 | -0.266 | -0.730 | 0.830 | 0.840 | -0.156 | -0.684 | 0.681 | -0.624 | -0.616 | -0.602 | -0.670 |
| FO | **** | **** | ** | ** | *** | 1.000 | -0.381 | 0.387 | 0.421 | 0.055 | 0.190 | 0.613 | 0.719 | 0.742 | 0.787 | -0.490 | -0.698 | 0.528 | 0.881 | -0.454 | 0.727 | 0.771 | 0.365 | 0.408 |
| Be | *** | * | * | 1.000 | -0.547 | -0.148 | 0.394 | 0.217 | -0.327 | -0.505 | -0.234 | -0.339 | 0.034 | 0.279 | -0.472 | -0.423 | 0.680 | -0.461 | -0.510 | 0.045 | 0.012 | |||
| Fr | **** | * | * | *** | 1.000 | 0.430 | -0.684 | -0.085 | 0.360 | 0.506 | 0.169 | 0.263 | 0.123 | -0.180 | 0.677 | 0.487 | 0.369 | 0.415 | 0.580 | -0.173 | -0.215 | |||
| VM | *** | *** | * | ** | ** | ** | 1.000 | -0.309 | 0.605 | 0.619 | 0.658 | 0.391 | 0.542 | -0.270 | -0.468 | 0.739 | 0.602 | 0.184 | 0.667 | 0.711 | 0.473 | 0.407 | ||
| SW | *** | ** | * | * | **** | 1.000 | 0.239 | -0.244 | -0.362 | 0.302 | -0.104 | 0.009 | 0.157 | -0.345 | -0.204 | -0.268 | -0.239 | -0.348 | 0.036 | 0.066 | ||||
| Be | **** | 1.000 | 0.333 | 0.329 | 0.350 | 0.383 | -0.273 | -0.296 | 0.335 | 0.304 | 0.060 | 0.400 | 0.334 | 0.549 | 0.468 | |||||||||
| FS | **** | **** | **** | **** | **** | **** | * | **** | * | 1.000 | 0.875 | 0.648 | 0.843 | -0.606 | -0.789 | 0.777 | 0.838 | -0.330 | 0.929 | 0.882 | 0.651 | 0.677 | ||
| Me | **** | **** | **** | **** | **** | **** | * | ** | **** | * | * | **** | 1.000 | 0.567 | 0.926 | -0.677 | -0.892 | 0.745 | 0.948 | -0.351 | 0.981 | 0.982 | 0.658 | 0.666 |
| Eg | *** | * | **** | * | * | **** | *** | 1.000 | 0.612 | -0.322 | -0.482 | 0.589 | 0.656 | -0.371 | 0.664 | 0.621 | 0.386 | 0.436 | ||||||
| MD | **** | **** | **** | **** | **** | **** | * | *** | * | **** | **** | **** | 1.000 | -0.812 | -0.958 | 0.579 | 0.948 | -0.552 | 0.942 | 0.907 | 0.754 | 0.787 | ||
| En | **** | *** | **** | **** | **** | ** | **** | **** | **** | 1.000 | 0.925 | -0.091 | -0.679 | 0.704 | -0.670 | -0.598 | -0.877 | -0.903 | ||||||
| CH | **** | **** | **** | **** | **** | **** | ** | **** | **** | ** | **** | **** | 1.000 | -0.418 | -0.896 | 0.618 | -0.881 | -0.847 | -0.827 | -0.852 | ||||
| P | *** | **** | * | ** | *** | ** | **** | **** | * | * | **** | **** | *** | *** | * | 1.000 | 0.698 | 0.171 | 0.776 | 0.807 | 0.233 | 0.219 | ||
| F | **** | **** | **** | **** | **** | **** | ** | ** | **** | **** | **** | **** | **** | **** | **** | **** | 1.000 | -0.407 | 0.939 | 0.961 | 0.609 | 0.625 | ||
| DF | *** | * | *** | **** | ** | * | * | * | * | *** | **** | **** | * | 1.000 | -0.382 | -0.283 | -0.543 | -0.642 | ||||||
| AP | **** | **** | **** | **** | **** | **** | ** | * | **** | * | **** | **** | **** | **** | **** | **** | **** | **** | * | 1.000 | 0.971 | 0.694 | 0.711 | |
| AF | **** | **** | **** | **** | **** | **** | * | *** | **** | * | * | **** | **** | **** | **** | *** | **** | **** | **** | **** | 1.000 | 0.591 | 0.593 | |
| UC | **** | * | **** | **** | *** | * | ** | *** | **** | **** | * | **** | **** | **** | **** | *** | **** | **** | 1.000 | 0.979 | ||||
| CD | **** | * | **** | **** | **** | * | * | ** | **** | **** | ** | **** | **** | **** | **** | **** | **** | **** | **** | 1.000 | ||||
| *P < 0.05, **P < 0.01, ***P < 0.001, ****P < 0.0001 Ri, Rice; Wh, wheat; Po, potatoes; Su, sugars; Co, confectioneries; FO, fats & oils; Be, beans; Fr, fruits; VM, vegetables & mushrooms; SW, seaweeds; Bev, beverages; FS, fishes & shellfishes; Me, meets; Eg, eggs; MD, milk & dairy products; En, energy; CH, carbohydrate; P, protein; F, fat; DF, dietary fiber; AP, animal protein; AF, animal fat; UC, ulcerative colitis; CD, Crohn’s disease |
||||||||||||||||||||||||
UC and CD showed a positive correlation with increased intake of potatoes, fish and shellfish, meats, and milk and dairy products and a negative correlation with intake of rice, sugars, and confectioneries (Table 2 and Figure 3).
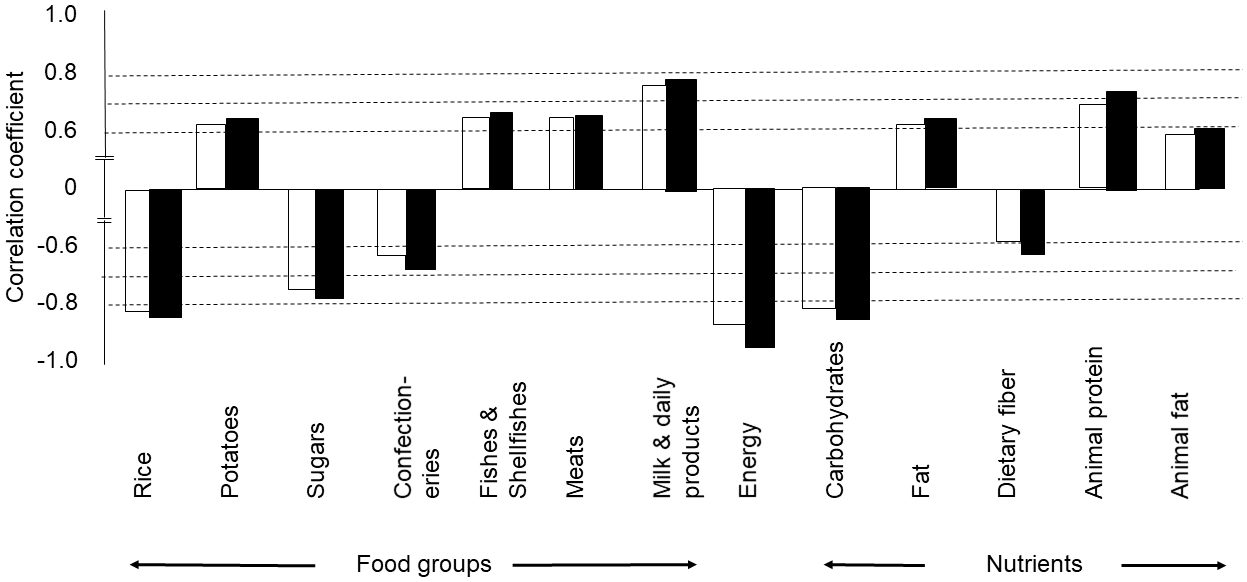
Rice intake showed the highest negative correlation coefficient among the 15 food groups to both UC (r = -0.825, 95% CI: -0.908 to -0.681, p < 0.0001) and CD (r = -0.836, 95% CI: -0.914 to -0.700, p <0.0001) (Table 2 and Figure 3).
For multiple regression analyses, rice, which showed the highest negative correlation coefficient to both UC and CD, was chosen as an explanatory variable. For the explanatory variables, foods with a high correlation coefficient (more than 0.8) to rice or foods with a nonsignificant correlation to UC/CD were excluded. Based on multiple regression analyses, three variables were extracted. Rice had the highest standard regression coefficient among three variables (rice, wheat, and fats and oils) for both UC (-1.670) and CD (-1.678) according to multiple regression analyses (Table 3). The regression coefficients were 0.958 and 0.967 for UC and CD, respectively (Table 3).
Table 3. Multiple Linear Regression between Food Intake and the Number of New Cases of Inflammatory Bowel Disease.
| Food | Ulcerative colitis | Crohn’s disease | ||||||
|---|---|---|---|---|---|---|---|---|
| Regression coefficient |
Standard regression coefficient |
p value | Regression coefficient |
Standard Regression coefficient |
p value | |||
| Rice | -54.463 | -1.670 | < 0.0001 | -17.186 | -1.678 | < 0.0001 | ||
| Wheat | -96.753 | -0.635 | < 0.0001 | -34.811 | -0.728 | < 0.0001 | ||
| Fats & oils | -354.432 | -0.452 | < 0.0001 | -88.677 | -0.360 | < 0.0001 | ||
| Intercept | 28703.128 | < 0.0001 | Intercept | 8894.132 | < 0.0001 | |||
| R | 0.958 | R | 0.967 | |||||
UC and CD showed a positive correlation with increased intake of fat, animal protein, and animal fat and a negative correlation with intake of energy, carbohydrates, and dietary fiber (Table 2 and Figure 3).
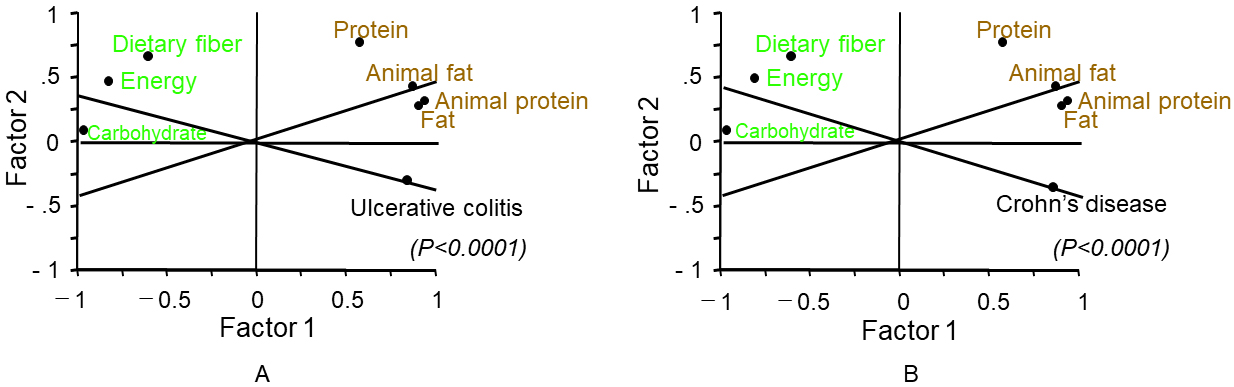
Factor analysis among the six nutrients and energy showed similar results for UC and CD. Factor 1 that comprised of high regression coefficients of animal protein, animal fat, and fat was considered as a westernized diet, and factor 2 that comprised of a high regression coefficient of dietary fiber was regarded as a traditional diet (Table 4). Fat, animal protein, and animal fat in the graph are close to UC/CD, and these were identified as promoting factors for IBD (Table 4 and Figure 4). In contrast, energy, carbohydrates, and dietary fiber were opposite to UC/CD, and these were identified as prophylactic factors against IBD (Figure 4).
Table 4. Factor Analysis among Six Nutrients and Energy and the Number of New Cases of Inflammatory Bowel Disease: Ulcerative Colitis (Upper Panel) and Crohn’s Disease (Lower Panel).
| Principal component |
Eigen value |
Proportion of variance |
Loading score | ||||||||||
|---|---|---|---|---|---|---|---|---|---|---|---|---|---|
| Energy | Carbo- hydrates |
Protein | Fat | Dietary fiber |
Animal protein |
Animal fat |
Ulcerative colitis |
||||||
| Factor 1 | 5.705 | 71.3% | -0.842 | -0.975 | 0.637 | 0.946 | -0.550 | 0.960 | 0.922 | 0.819 | |||
| Factor 2 | 1.681 | 21.0% | 0.490 | 0.160 | 0.747 | 0.200 | 0.727 | 0.245 | 0.357 | -0.318 | |||
| Factor 3 | 0.368 | 4.6% | |||||||||||
| Factor 4 | 0.180 | 2.3% | |||||||||||
| Principal component |
Eigen value |
Proportion of variance |
Energy | Carbo- hydrates |
Protein | Fat | Dietary fiber |
Animal protein |
Animal fat |
Crohn's disease |
|||
| Factor 1 | 5.729 | 71.6% | -0.847 | -0.976 | 0.628 | 0.944 | -0.567 | 0.957 | 0.917 | 0.834 | |||
| Factor 2 | 1.726 | 21.6% | 0.474 | 0.143 | 0.753 | 0.215 | 0.725 | 0.257 | 0.371 | -0.372 | |||
| Factor 3 | 0.290 | 3.6% | |||||||||||
| Factor 4 | 0.196 | 2.4% | |||||||||||
| Overall significance of p < 0.0001 in both upper and lower panels which contain ulcerative colitis and Crohn’s disease, respectively | |||||||||||||
This study showed that the incidence of IBD was associated with dietary westernization (Table 1 and Figure 1). The characteristics of dietary westernization, i.e., increased intake of animal protein and animal fat with decreased intake of rice, were observed over the survey time. The incidence of IBD rapidly increased during the same period. Analyzing not only selected foods but all food groups and nutrients, this study revealed that the correlation coefficient of decreased rice intake to both UC and CD was higher than those of increased intake of meat, fish and shellfish, and milk and dairy products (Table 2 and Figure 3).
The association of IBD increase and dietary westernization was not specially stated, but it was historically indicated. In the United States, the ratio of fat and carbohydrates to total energy intake gradually increased and decreased, respectively, during the 70 years between 1910 and 1980, i.e., from 33% to 43% and from 55% to 46%, respectively. The protein ratio increased only 1%, from 12% to 13% (37). This seems to be a gradual dietary westernization. In other western countries, a dramatic dietary transition to a westernized diet occurred after World War II (1941-1945) (38). A rising incidence of IBD in the west commenced in the 1950s (39). Therefore, an increase in the incidence of IBD occurred after dietary westernization in the western world. After World War II, Japan experienced an economic reconstruction period (1950-1960) followed by a period of high economic growth (1960-1975) (35). The decrease in rice intake commenced in 1965 with an increase in intake of animal fat and animal protein (Figure 1) (35), (40). Dietary transition similar to that in the United States was observed in Japan, although the ratios of macronutrients to total energy intake were different. That is, the ratio of fat intake increased from 14.8% in 1965 to 26.5% in 2000 while that of carbohydrates decreased from 72.1% to 57.5% in the corresponding year, respectively. The ratio of protein intake increased only 2.6%, from 13.3% to 15.9% (40).
Dietary transition in the United States, Europe, and Japan is typically associated with socioeconomic transition. However, the development of a food industry that produces foods rich in fats at low cost and urbanization induced similar dietary westernization in lower-income countries. Popkin pointed out a global dietary transition from a traditional diet to a westernized diet in Asia, South America, and Africa between 1962 and 1994. They also warned that such a transition was destined to result in an increase in the incidence of chronic diseases, including coronary heart disease, stroke, and diabetes mellitus (22), (41). The fear became real. The incidence of diet-related obesity and chronic diseases has been steadily increasing, becoming a global health concern (42). The epidemiology of diet-related chronic diseases and IBD is more or less similar.
As observed above, there might be a great variety in dietary transition (westernization) in terms of speed, degree, and mode of adaption to the transition among countries, races, and individuals based on their culture and tradition. Likewise, other lifestyles associated with socioeconomic transition and related to IBD are heterogenous. This seems to be one of the explanations for inconsistent results or contradictory findings of the relation between diet and IBD (12), (13), (14), (15), (16), (17). Therefore, cautious comprehensive analysis is needed for interpretation of the results. The lack of consistent evidence has hampered the formulation of dietary guidelines for IBD, with the exception of exclusive enteral nutrition in CD (43).
Increased sugar consumption is one of the characteristics of dietary westernization, but in the present study, sugar consumption peaked at 20.7 g in 1969 and then started to decrease (Table 1). Consequently, sugar intake was negatively correlated with the increased incidence of IBD (Table 2 and Figure 3). This would be another example of a variety of dietary westernization in which sugar intake was not increased in Japan. Case-control studies in Japan showed that patients with pre-illness CD consumed more sugars than controls (44), (45).
Extremely high correlations between CD and UC were observed in the annual numbers of new cases and the annual numbers of cases (Figure 2). This is consistent with an earlier report (46). This observation indicates that there is a common environmental factor in the onset of the two diseases. Cohort studies of dietary fiber, ratio of omega-3/omega-6 polyunsaturated fatty acids, and dietary patterns with high inflammatory potential showed no identical effect for onset of both UC and CD but showed an effect for either UC or CD (14), (15), (47). Therefore, these factors do not seem to be key factors in IBD. In this study, dietary westernization was associated with the incidence of both UC and CD.
If dietary westernization is associated with onset of IBD, our current (westernized) diet has to be scrutinized. Current global consumption consists of an excess of unhealthy foods such as red meat, sugar, and refined grains and a shortage of healthy foods such as vegetables, fruits, legumes, whole grains, and nuts (42), (48). The former and the latter largely overlap risk factors and preventive factors, respectively, in IBD (12), (13), (14), (15), (16), (17). Basic research has revealed that a westernized diet tends to be pro-inflammatory, while a plant-based diet (PBD) tends to be anti-inflammatory (9), (10), (11), (12), (38), (49). It is a pity that the incidence of IBD has repeatedly increased in regions where IBD was absent or rare. It is easily anticipated that the incidence of chronic diseases and IBD will increase worldwide, unless people, including care providers, notice that the current westernized diet is problematic (22), (41), (42), (48). The recommended healthy reference diet suggests moderate consumption of animal food and sugar and increased consumption of vegetables and fruits (42), (48). Considerable moderation of animal foods is categorized as a PBD. PBDs are recommended to the public as a healthy diet to prevent common chronic diseases (42), (48). We believe that generalization of a healthy reference diet or PBD will decrease the incidence of diet-related chronic diseases, including IBD.
As a matter of fact, the present authors have recognized that IBD is a lifestyle disease mediated mainly by a westernized diet (50), (51). Therefore, we developed and began to provide a PBD to replace an omnivorous (westernized) diet for Japanese patients with IBD in 2003 (50). We published far better outcomes in terms of both induction and relapse rate in both diseases as compared with the current standard (50), (52), (53), (54). Consequently, we recommended PBD for IBD (55). The present epidemiological study obviously does not show a causal relation between diet and IBD, but it does support our assertion.
Our study has some limitations. The number of new cases between 1965 and 1975 may be underestimated as IBD was rare in those days, and there might be cases undiagnosed as IBD. Food groups differ from country to country. This study did not evaluate fast food, food additives including artificial sweeteners (45) and emulsifiers (56), and ultra-processed food (57), which are associated with the development of the food industry. We hope that other studies will be conducted to validate our results.
In conclusion, the incidence of IBD increased in Japan in association with westernization of the diet. Appreciation of the association of IBD incidence with dietary westernization will change the current therapeutic modality and contribute to establishment of a policy against further increase in the incidence of IBD.
None
The authors thank Marcin J. Schroeder, Ph.D., Professor of Mathematics at Akita International University (Present: Specially Appointed Professor, Global Learning Center, Institute for Excellence in Higher Education, Tohoku University), for the statistical review.
MC: design, data acquisition, analysis, interpretation, and manuscript writing. NM and AN: data acquisition, analysis, interpretation, and manuscript critical revision. KT and EH: data acquisition and manuscript critical revision. All authors approved the final version of the manuscript for submission.
Ng SC, Shi HY, Hamidi N, et al. Worldwide incidence and prevalence of inflammatory bowel disease in the 21st century: a systematic review of population-based studies. Lancet. 2017;390(10114):2769-78.
Ng WK, Wong SH, Ng SC. Changing epidemiological trends of inflammatory bowel disease in Asia. Intest Res. 2016;14(2):111-9.
Kaplan GG, Ng SC. Understanding and preventing the global increase of inflammatory bowel disease. Gastroenterology. 2017;152(2):313-21.
Murakami Y, Nishiwaki Y, Oba MS, et al. Estimated prevalence of ulcerative colitis and Crohn’s disease in Japan in 2015: an analysis of nationwide survey. J Gastroenterol. 2019;54(12):1070-7.
Bernstein CN, Shanahan F. Disorders of a modern lifestyle: reconciling the epidemiology of inflammatory bowel diseases. Gut. 2008;57(9):1185-91.
Ng SC, Tang W, Leong RW, et al. Environmental risk factors in inflammatory bowel disease: a population-based case-control study in Asia-Pacific. Gut. 2015;64(7):1063-71.
Wu GD, Chen J, Hoffmann C, et al. Linking long-term dietary patterns with gut microbial enterotypes. Science. 2011;334(6052):105-8.
David LA, Maurice CF, Carmody RN, et al. Diet rapidly and reproducibly alters the human gut microbiome. Nature. 2014;505(7484):559-63.
Sonnenburg ED, Sonnenburg JL. Starving our microbial self: the deleterious consequences of a diet deficient in microbiota-accessible carbohydrates. Cell Metab. 2014;20(5):779-86.
Tilg H, Moschen AR. Food, immunity, and the microbiome. Gastroenterology. 2015;148(6):1107-19.
Pittayanon R, Lau JT, Leontiades GI, et al. Differences in gut microbiota in patients with vs without inflammatory bowel diseases: a systematic review. Gastroenterology. 2020;158(4):930-46.
Amre DK, D’Souza S, Morgan K, et al. Imbalance in dietary consumption of fatty acids, vegetables, and fruits are associated with risk for Crohn’s disease in children. Am J Gastroenterol. 2007;102(9):2016-25.
Hou JK, Abraham B, El-Serag H. Dietary intake and risk of developing inflammatory bowel disease: a systematic review of the literature. Am J Gastroenterol. 2011;106(4):563-73.
Ananthakrishnan AN, Khalili H, Konijeti GG, et al. A prospective study of long-term intake of dietary fiber and risk of Crohn’s disease and ulcerative colitis. Gastroenterology. 2013;145(5):970-7.
Ananthakrishnan AN, Khalili H, Konijeti GG, et al. Long-term intake of dietary fat and risk of ulcerative colitis and Crohn’s disease. Gut. 2014;63(5):776-84.
Dolan KT, Chang EB. Diet, gut microbes, and the pathogenesis of inflammatory bowel diseases. Mol Nut Food Res. 2017;61(1). doi: 10.1002/mnfr.201600129.
Khalili H, Chan SSM, Lochhead P, et al. The role of diet in the etiopathogenesis of inflammatory bowel disease. Nat Rev Gastroenterol Hepatol. 2018;15(9):525-35.
Hu FB. Dietary pattern analysis: a new direction in nutritional epidemiology. Curr Opin Lipidol. 2002;13(1):3-9.
Khalili H, Håkansson N, Chan SS, et al. Adherence to a Mediterranean diet is associated with a lower risk of later-onset Crohn’s disease: results from two large prospective cohort studies. Gut. 2020;69(9):1637-44.
Racine A, Carbonnel F, Chan SS, et al. Dietary patterns and risk of inflammatory bowel disease in Europe: results from the EPIC study. Inflamm Bowel Dis. 2016;22(2):345-54.
Fejfar Z. Prevention against ischaemic heart disease: a critical review. London: Butterworths; 1974. Modern trends in cardiology; p. 465-99.
Popkin BM. The nutrition transition in low-income countries: an emerging crisis. Nutr Rev. 1994;52(9):285-98.
Ikeda N, Saito E, Kondo N, et al. What has made the population of Japan healthy? Lancet. 2011;378(9796):1094-105.
Kitahora T, Utsunomiya T, Yokota A, et al. Epidemiological study of ulcerative colitis in Japan: incidence and familial occurrence. J Gastroenterol. 1995;30(Suppl VIII):5-8.
Farmer RG, Michener WM, Mortimer EA. Studies of family history among patients with inflammatory bowel disease. Clin Gastroenterol. 1980;9(2):271-7.
Shoda R, Matsueda K, Yamato S, et al. Epidemiological analysis of Crohn disease in Japan: increased dietary intake of n-6 polyunsaturated fatty acids and animal protein relates to the increased incidence of Crohn disease in Japan. Am J Clin Nutr. 1996;63(5):741-5.
Chiba M, Morita N, Nakamura A, et al. Inflammatory bowel disease (Crohn’s disease and ulcerative colitis) is thought to be lifestyle disease mediated mainly by diet. The Ministry of Health and Welfare of Japan; 2002. Annual report of the Research Committee of Inflammatory Bowel Disease; p. 126-30. Japanese.
Asakura K, Nishiwaki Y, Inoue N, et al. Prevalence of ulcerative colitis and Crohn’s disease in Japan. J Gastroenterol. 2009;44(7):659-65.
Number of registered cases of intractable diseases [Internet]. The Ministry of Health, Labor and Welfare of Japan [cited 2020 Oct 29]. Available from: https://www.nanbyou.or.jp/entry/1356. Japanese.
Ulcerative colitis [Internet]. Japan Intractable Disease Information Center [updated 2020 Sep; cited 2020 Oct 29]. Available from: http://wwww.nanbyou.or.jp/entry/62.
Crohn’s disease [Internet]. Japan Intractable Disease Information Center [updated 2020 Sep; cited 2020 Oct 29]. Available from: http://wwww.nanbyou.or.jp/entry/81.
Nakamura Y, Kobayashi M, Nagai M, et al. A case-control study of ulcerative colitis in Japan. J Clin Gastroenterol. 1994;18(1):72-9.
Sasagawa T, Kimura A. [Nationwide epidemiological studies of Crohn’s disease. The Ministry of Health and Welfare]; 1988. Annual report of the Research Committee for Intractable Intestinal Diseases; p. 97-101. Japanese.
Utsunomiya T, Katsumata T, Nakayama T, et al. [Epidemiology of ulcerative colitis]. Geka (Surgery). 1992;54(1):13-20. Japanese.
Katanoda K, Matsumura Y. National Nutrition Survey in Japan ―its methodological transition and current findings. J Nutr Sci Vitaminol (Tokyo). 2002;48(5):423-32.
Tsuji K, Harashima E, Nakagawa Y, et al. Time-lag effect of dietary fiber and fat intake ratio on Japanese colon cancer mortality. Biomed Environ Sci. 1996;9(2-3):223-28.
Wolf ID, Peterkin BB. Dietary guidelines: the USDA perspective. Food Technol. 1984;38(7):80-6.
Rizzello F, Spisni E, Giovanardi E, et al. Implications of the Westernized diet in the onset and progression of IBD. Nutrients. 2019;11(5):1033.
Whelan G. Inflammatory bowel disease: epidemiology. 5th ed. Philadelphia: W.B. Saunders; 1995. Gastroenterology. Volume 2; p. 1318-25.
Tada N, Maruyama C, Koba S, et al. Japanese dietary lifestyle and cardiovascular disease. J Atheroscler Thromb. 2011;18(9):723-34.
Drewnowski A, Popkin BM. The nutrition transition: new trends in the global diet. Nutr Rev. 1997;55(2):31-43.
Willett W, Rockström J, Loken B, et al. Food in the Anthropocene: the EAT-Lancet Commission on healthy diets from sustainable food systems. Lancet. 2019;393(10170):447-92.
Lamb CA, Kennedy NA, Raine T, et al. British Society of Gastroenterology consensus guidelines on the management of inflammatory bowel disease in adults. Gut. 2019;68(Suppl 3):s1-106.
Matsui T, Iida M, Fujishima M, et al. Increased sugar consumption in Japanese patients with Crohn’s disease. Gastroenterol Jpn. 1990;25(2):271.
Sakamoto N, Kono S, Wakai K, et al. Dietary risk factors for inflammatory bowel disease: a multicenter case-control study in Japan. Inflamm Bowel Dis. 2005;11(2):154-63.
Sonnenberg A. Geographic variation in the incidence of and mortality from inflammatory bowel disease. Dis Colon Rectum. 1986;29(12):854-61.
Lo CH, Lochhead P, Khalili H, et al. Dietary inflammatory potential and risk of Crohn’s disease and ulcerative colitis. Gastroenterology. 2020;159(3):873-83.
US Department of Health and Human Services and US Department of Agriculture. 2015-2020 Dietary guidelines for Americans [Internet]. 8th ed. 2015 Dec [cited 2021 Mar 1]. Available from: http://health.gov/dietaryguidelines/2015/guidelines/.
Singh RK, Chang HW, Yan D, et al. Influence of diet on the gut microbiome and implications for human health. J Transl Med. 2017;15(1):73.
Chiba M, Abe T, Tsuda H, et al. Lifestyle-related disease in Crohn’s disease: relapse prevention by a semi-vegetarian diet. World J Gastroenterol. 2010;16(20):2484-95.
Chiba M, Nakane K, Komatsu M. Westernized diet is the most ubiquitous environmental factor in inflammatory bowel disease. Perm J. 2019;23(1):18-107.
Chiba M, Tsuji T, Nakane K, et al. Induction with infliximab and plant-based diet as first-line (IPF) therapy for Crohn disease: a single-group trial. Perm J. 2017;21(4):17-009.
Chiba M, Nakane K, Tsuji T, et al. Relapse prevention by plant-based diet incorporated into induction therapy for ulcerative colitis: a single group trial. Perm J. 2019;23(2):18-220.
Chiba M, Tsuji T, Nakane K, et al. High remission rate with infliximab and plant-based diet as first-line (IPF) therapy for severe ulcerative colitis: single-group trial. Perm J. 2020;24(5):19.166.
Chiba M, Ishii H, Komatsu M. Recommendation of plant-based diet for inflammatory bowel disease. Transl Pediatr. 2019;8(1):23-7.
Sandall AM, Cox SR, Lindsay JO, et al. Emulsifiers impact colonic length in mice and emulsifier restriction is feasible in people with Crohn’s disease. Nutrients. 2020;12(9):2827.
Monteiro CA, Cannon G, Levy RB, et al. Ultra-processed foods: what they are and how to identify them. Public Health Nutr. 2019;22(5):936-41.
