Corresponding author: Kazuhiko Kotani, kazukotani@jichi.ac.jp
DOI: 10.31662/jmaj.2023-0052
Received: April 3, 2023
Accepted: July 7, 2023
Advance Publication: September 27, 2023
Published: October 16, 2023
Cite this article as:
Nakamura A, Kotani K, Hatakeyama S, Obayashi S, Nagai R. Regional Variations in Coronavirus Disease 2019 Mortality in Japan: An Ecological Study. JMA J. 2023;6(4):397-403.
Introduction: As the characteristics of coronavirus disease 2019 (COVID-19) vary across regions and countries, the relationship between regional characteristics, such as the distribution of physicians and hospital beds, and COVID-19 mortality was assessed in the 47 prefectures of Japan.
Methods: This ecological study was based on the number of patients with COVID-19 by prefecture during the seventh wave of COVID-19 in Japan (June-October 2022). COVID-19 mortality was indexed as the number of COVID-19 deaths divided by the number of new COVID-19 cases. Data on regional factors, such as population size, number of physicians, and hospital beds by prefecture, were obtained from government statistics. Correlations between regional characteristics and COVID-19 mortality index were analyzed by dividing the 47 prefectures into two groups at the median level of population size (more populated group [MPG] ≥ 1.6 million and less populated group [LPG] < 1.6 million).
Results: The COVID-19 mortality index (mean 12.7, minimum-maximum: 4.7-25.7) was correlated negatively with the number of physicians per hospital bed (r = −0.386, p = 0.007) and positively with the number of long-term care facilities per 10,000 population (r = 0.397, p = 0.006) and aging rate (the proportion of population aged ≥ 65 years) (r = 0.471, p = 0.001). The two groups varied with respect to the number of physicians (28.7 physicians in the LPG vs. 26.1 physicians in the MPG, p = 0.038) and hospital beds (156 beds in the LPG vs. 119 beds in the MPG, p < 0.001) per 10,000 population. In the multiple regression analysis, the COVID-19 mortality index was correlated negatively with the number of physicians per hospital bed (β = −0.543, p = 0.024) and positively with the aging rate (β = 0.434, p = 0.032) in the LPG, with nonsignificant correlations in the MPG.
Conclusions: The data may suggest a need of improvement in the distribution of physicians and hospital beds in the healthcare system in regions with smaller and older populations to reduce the rate of COVID-19.
Key words: Regional characteristics, COVID-19 mortality, physicians, hospital beds, ecological study, Japan
Coronavirus disease 2019 (COVID-19) is an infectious disease caused by severe acute respiratory syndrome coronavirus-2 (SARS-CoV-2) (1), (2), (3). It can cause severe viral pneumonia with respiratory failure that results in death (1), (2). COVID-19 has been declared as a pandemic (4), and as of February 28, 2023, approximately 6.8 million deaths have been reported worldwide (5). In Japan, the number of new COVID-19 cases drastically increased during the seventh wave of COVID-19 from June to October 2022 (5), (6). The seventh wave was a pandemic of Omicron variant BA.5 (7). At the peak of this wave, the number of new cases per week in Japan reached 1.49 million (6), accounting for 21% of the total number of new cases worldwide per week (5). Under these conditions, 14,805 deaths caused by COVID-19 have been confirmed in Japan (6). Even before the COVID-19 pandemic, Japan has been facing the challenges of a super-aged society (8), (9), unrestricted access to medical institutions (a patient can visit any medical institution of their choice without a referral letter, including tertiary hospitals) (10), (11), and shortage of physicians (12). The COVID-19 pandemic has promoted the momentum for developing a more efficient healthcare system (13), (14).
Given the manner of COVID-19 transmission (15), regional characteristics, such as the distribution of physicians and hospital beds, can also play important roles in COVID-19-related outcomes (16), (17). A regional healthcare policy is planned at the prefectural level in Japan, which consists of 47 prefectures (11), (18). Because regional healthcare policies are unique to each prefecture, there are regional differences in the distribution of physicians and hospital beds (11), (19). These 47 prefectures include certain large regions, such as Tokyo, Osaka, and Aichi, and certain smaller regions with a population of less than one million (20). This ecological study was conducted to examine the relationship between regional characteristics and COVID-19 mortality.
This ecological study was conducted based on the numbers of COVID-19 new cases and deaths by prefecture during the seventh wave of the pandemic from June 22 to October 18, 2022 (21). In this study, the COVID-19 mortality index was defined as the number of COVID-19 deaths divided by the number of COVID-19 new cases during the study period multiplied by 10,000. The number of physicians per hospital bed (22), (23), (24), number of long-term care facilities (25), (26), (27), and aging rate (28), (29) were used as regional characteristics in this study. The number of physicians per hospital bed was used as a measure of the distribution of physicians and hospital beds in the healthcare system. Aging rate was defined as the proportion of population aged ≥65 years. The numbers of new COVID-19 cases and deaths by prefecture were obtained from the information provided by the Ministry of Health, Labour, and Welfare (6). Furthermore, the number of physicians by prefecture was obtained from the 2020 Statistics of Physicians, Dentists, and Pharmacists (30). The number of hospital beds by prefecture was obtained from the 2021 Survey of Medical Institutions (19). The number of long-term care facilities by prefecture was obtained from the 2020 Survey of Institutions and Establishments for Long-Term Care (31) and the 2020 Survey of Social Welfare Institutions (32). In addition, the population and aging rates by prefecture were obtained from the 2020 Population Census of Japan (20).
This study was conducted using publicly available government statistics, and personal information was not addressed. Therefore, this study did not require approval from the institutional review board.
The parameters in each prefecture were averaged while expressing the results of this study. Univariate and multiple linear regression analyses were conducted using the number of physicians per hospital bed, number of long-term care facilities per 10,000 persons, and aging rate by prefecture as independent variables and the COVID-19 mortality index as dependent variable. Furthermore, multiple linear regression analyses were conducted using the forced entry method for all three independent variables. Subsequently, stratified analysis was conducted by dividing the 47 prefectures into two groups at the median level of population size (more populated group ≥ 1.6 million and less populated group < 1.6 million). The parameters of each prefecture between the less and more populated groups were compared using the two-sample t-test. SPSS version 27 (IBM, Armonk, NY, USA) was used for all statistical analyses, and the significance levels were two-tailed. A p-value <0.05 indicated statistical significance.
The mean COVID-19 mortality index for the 47 prefectures during the seventh wave of COVID-19 in Japan was 12.7 (minimum-maximum: 4.7-25.7). Up to a 5.5-fold difference in the COVID-19 mortality index was observed among the prefectures. The mean values for each regional characteristic are presented in Table 1. In the univariate analysis, the COVID-19 mortality index was correlated negatively with the number of physicians per hospital bed (r = −0.386, p = 0.007) (Table 2) (Figure 1) and positively with the number of long-term care facilities per 10,000 persons and the aging rate (r = 0.397, p = 0.006; r = 0.471, p = 0.001, respectively). Multiple linear regression analyses revealed a nonsignificant correlation between the regional factors and the COVID-19 mortality index (Table 2).
Table 1. COVID-19 Mortality Index and Regional Characteristics (Japan).
| Overall | Less populated group (<1.6 million) (n = 24) |
More populated group (≥1.6 million) (n = 23) |
p-value | |
|---|---|---|---|---|
| COVID-19 mortality index, mean (SD) | 12.7 (4.0) | 14.0 (4.9) | 11.4 (3.0) | 0.026※ |
| Number of physicians per hospital bed, mean (SD) | 0.21 (0.04) | 0.19 (0.03) | 0.23 (0.05) | 0.002※ |
| Number of physicians per 10,000 population, mean (SD) | 27.4 (4.3) | 28.7 (3.6) | 26.1 (4.7) | 0.038※ |
| Number of hospital beds per 10,000 population, mean (SD) | 137 (35) | 156 (30) | 119 (28) | <0.001※ |
| Number of LTCF per 10,000 population, mean (SD) | 4.29 (1.4) | 5.12 (1.3) | 3.42 (1.0) | <0.001※ |
| Aging rate (≥65 y) (%), mean (SD) | 30.7 (3.1) | 32.3 (3.0) | 29.1 (2.4) | <0.001※ |
| COVID-19: coronavirus disease 2019, SD: standard deviation, LTCF: long-term care facilities ※p < 0.05 |
||||
Table 2. Association between Regional Characteristics and COVID-19 Mortality Index in All the 47 Prefectures.
| Variables | Univariable | Multivariable※※ | ||
|---|---|---|---|---|
| Correlation coefficient | p-value | Beta | p-value | |
| Number of physicians per hospital bed | −0.386 | 0.007※ | −0.053 | 0.805 |
| Number of LTCF per 10,000 population | 0.397 | 0.006※ | 0.099 | 0.643 |
| Aging rate (≥65 y) (%) | 0.471 | 0.001※ | 0.362 | 0.094 |
| COVID-19: coronavirus disease 2019, LTCF: long-term care facilities ※p < 0.05 ※※Multiple linear regression analyses were conducted using the forced entry method for all three independent variables. |
||||
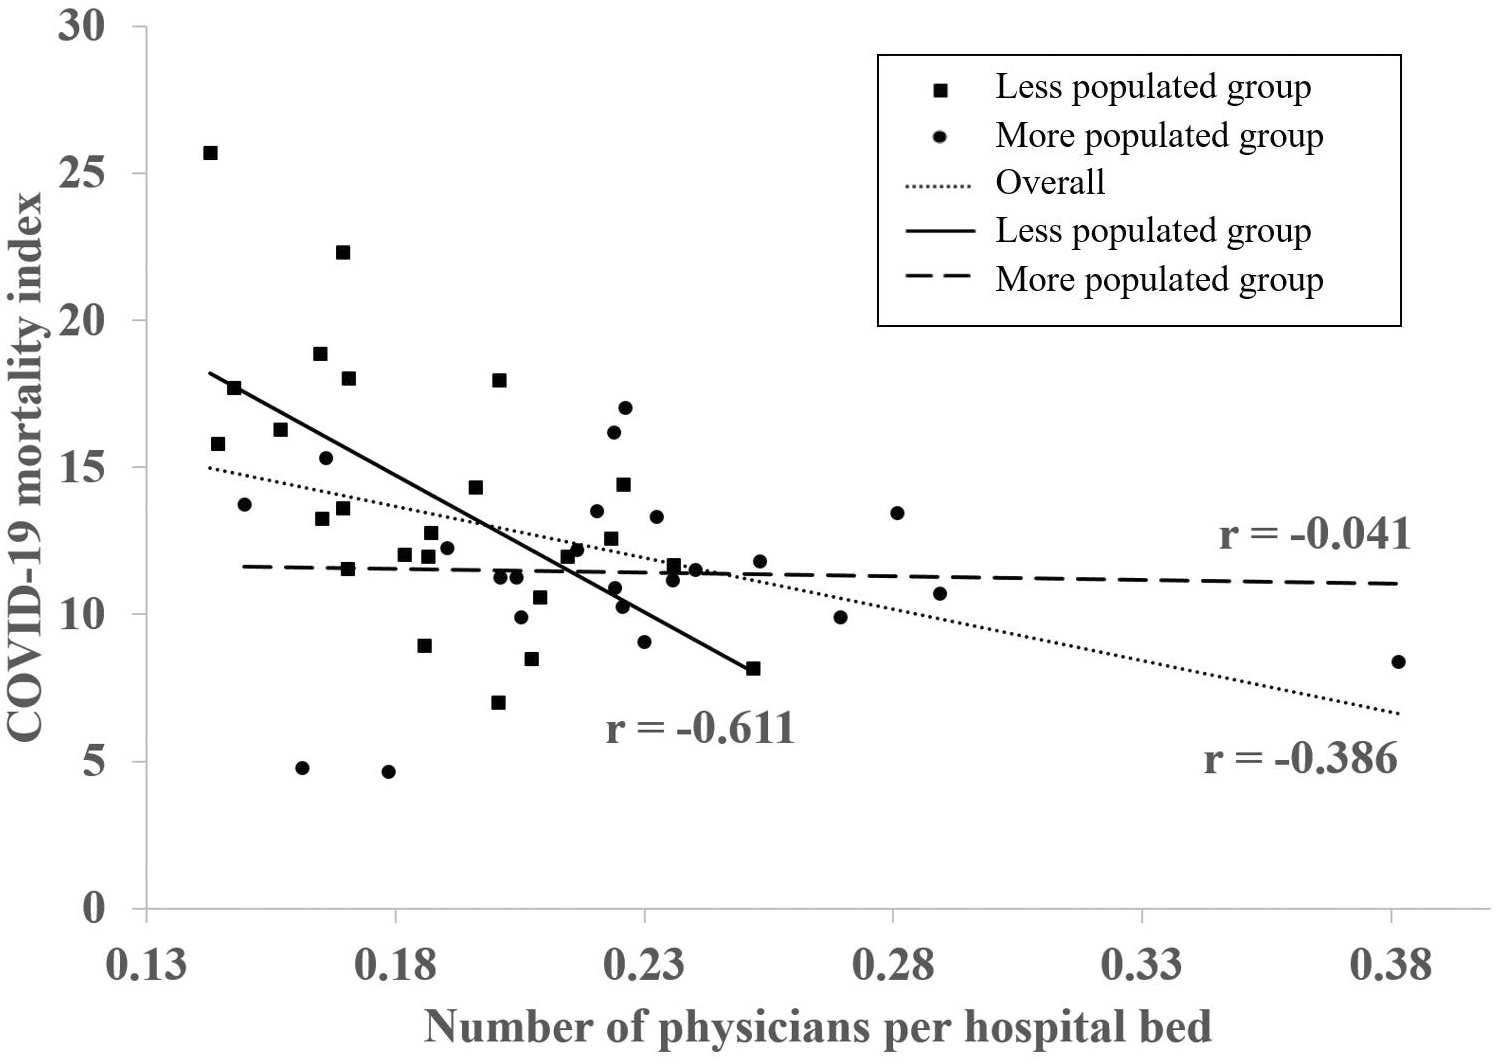
Thereafter, the 47 prefectures were divided into less populated and more populated groups at the median level of population size, and the COVID-19 mortality index and regional characteristics were compared between these groups (Table 1). The mean COVID-19 mortality indices in the less and more populated groups were 14.0 (minimum-maximum: 7.0-25.7) and 11.4 (minimum-maximum: 4.7-17.0), respectively. The more populated group had significantly lower mean COVID-19 mortality index than the less populated group (p = 0.026). Furthermore, the mean number of physicians per hospital bed was significantly higher in the more populated than the less populated group (p = 0.002). The mean number of physicians per 10,000 population in the more populated group (26.1 physicians) was significantly lower than that in the less populated group (28.7 physicians) (p = 0.038). In addition, the mean number of beds per 10,000 persons was significantly lower in the more populated group (119 hospital beds) than the less populated group (156 hospital beds) (p < 0.001). The mean number of long-term care facilities per 10,000 persons and the mean aging rate were significantly lower in the more populated group than the less populated group (p < 0.001 and p < 0.001, respectively). In the stratified multiple linear regression analyses (forced entry method) for the less populated group, the COVID-19 mortality index was correlated negatively with the number of physicians per hospital bed (β = −0.543, p = 0.024) and positively with the aging rate (β = 0.434, p = 0.032) (Table 3). In the multiple linear regression analyses for the more populated group, a nonsignificant correlation was observed between the regional factors and COVID-19 mortality index.
Table 3. Association between Regional Characteristics and COVID-19 Mortality Index According to Population Size.
| Variables | Univariable | Multivariable※※ | ||
|---|---|---|---|---|
| Correlation coefficient | p-value | Beta | p-value | |
| Less populated group (<1.6 million) (n = 24) | ||||
| Number of physicians per hospital bed | −0.611 | 0.002※ | −0.543 | 0.024※ |
| Number of LTCF per 10,000 population | 0.352 | 0.091 | −0.231 | 0.304 |
| Aging rate (≥65 y) (%) | 0.601 | 0.002※ | 0.434 | 0.032※ |
| More populated prefectures (≥1.6 million) (n = 23) | ||||
| Number of physicians per hospital bed | −0.041 | 0.852 | −0.139 | 0.628 |
| Number of LTCF per 10,000 population | 0.098 | 0.656 | 0.293 | 0.409 |
| Aging rate (≥65 y) (%) | −0.053 | 0.811 | −0.432 | 0.334 |
| COVID-19: coronavirus disease 2019, LTCF: long-term care facilities ※p < 0.05 ※※Multiple linear regression analyses were conducted using the forced entry method for all three independent variables. |
||||
In this study, a 5.5-fold difference was observed in the COVID-19 mortality index by region. Such differences have also been observed in several regions (22), (23), (33), (34). For example, a previous study in 30 European countries reported up to 185-fold regional differences in the COVID-19-related deaths among these nations (34). Another previous study in Italy reported differences of up to 9.9-fold in COVID-19 mortality among regions (22); similar results were observed in Japan. That Italian study reported a negative correlation between COVID-19-related deaths and the number of physicians; furthermore, a positive correlation was observed between COVID-19-related deaths and the number of hospital beds (22). Several previous studies have shown a negative correlation between COVID-19 mortality and the number of physicians (22), (23), (24). However, there was an inconsistent trend in the relationship between the number of hospital beds and COVID-19 mortality (22), (23), (24), (35).
In this study, the number of physicians per hospital bed was not significantly correlated with the COVID-19 mortality index in the more populated group and was negatively correlated with the COVID-19 mortality index in the less populated group. This finding indicates that there were fewer COVID-19-related deaths in cases where the number of physicians per hospital bed was higher in regions with a smaller population. Different results were obtained for the less and more populated groups, which could be explained by some speculations.
First, the differences in the number of physicians per hospital bed between the two groups should be considered. The number of physicians per hospital bed was lower in the less populated group than the more populated group. Of all the members of the Organization for Economic Cooperation and Development (OECD), Japan has the highest number of hospital beds per 1,000 population (12.8 hospital beds/1000 population) (OECD average: 4.4 hospital beds/1,000 population); also, the number of physicians per 1,000 population (2.5 physicians/1,000 population) in Japan is well below the OECD average (3.6 physicians/1,000 population) (36). Therefore, it has been dealing with a large number of hospital beds with a relatively few medical staff. In the less populated group, this situation could have been more pronounced, increasing the burden per physician and probably resulting in an increase in the number of COVID-19-related deaths. Second, the differences in the number of hospital beds between the two groups should also be considered. The less populated group had more hospital beds than the more populated group. Hospital inpatients are often older adults or patients with underlying medical conditions; they are known to be vulnerable to nosocomial infection with COVID-19 and have a poor prognosis (37), (38), (39). In Japan, nosocomial outbreaks were confirmed in many regions during the seventh wave of COVID-19 (40), (41). Thus, the less populated group had more hospital beds and was at an increased risk of exposure to nosocomial infections, which might have resulted in more COVID-19-related deaths.
In this study, COVID-19 mortality and aging rate had a nonsignificant correlation in the more populated group but a positive correlation in the less populated group. Older adults have been reported to be at an increased risk for COVID-19-related death (28), (29), and the aging rate was higher in the less populated than the more populated group. Thus, COVID-19-related deaths may have been more common in Japan in regions with a large elderly population.
Japan has the highest aging rate in the world, which is expected to further increase in the future (8), (11). This rising aging rate has promoted a momentum for the development of an efficient healthcare system; this healthcare system reform is called Regional Medical Care Visions in Japan (11), (42). The distribution of physicians and hospital beds could be possibly organized while strengthening the cooperation among medical institutions and between medical and nursing care as well as enhancing home medical care under this reform initiative (11), (42). In this study, the number of physicians per hospital bed was negatively correlated with COVID-19 mortality in the less populated group. The findings of this study suggest a potential need for organizing the distribution of physicians and hospital beds in the healthcare system in regions with smaller populations, even regarding COVID-19 measures.
The strength of this study was the high reliability of the results as government statistical data were used. Analysis was conducted for units of the 47 prefectures, which allowed the use of government statistics. Nevertheless, this study has several limitations. First, this is an observational study with prefectures used as the unit of observation and therefore cannot demonstrate causal relationships. Second, the risk of death among Omicron-positive individuals is known to be age-dependent (43); however, in this study, age adjustment could not be performed for the COVID-19 mortality index because the ages of patients who died due to COVID-19 were not publicly available in approximately one-third of the prefectures. Third, factors such as climate and the number of international travelers to Japan are known to be related to COVID-19 mortality (33), (44); however, detailed regional data on these factors were not considered in this study. Fourth, this study analyzed the seventh wave, when Omicron variant BA.5 was predominant (7); however, whether similar results will be obtained in future pandemics may depend on the emergence of mutant strains and regional conditions.
In conclusion, COVID-19 mortality was negatively correlated with the number of physicians per hospital bed and positively with the aging rate in the less populated group. These findings suggest a potential need for organizing the distribution of physicians and hospital beds in the healthcare system in regions with a smaller and older population, even regarding COVID-19 measures.
None
This work was supported by [KAKENHI] grant number [JP21K17230] from the Japan Society for the Promotion of Science (JSPS).
The authors are grateful to the Japan Society for the Promotion of Science (JSPS) for providing a grant to conduct this study.
RN and SO conceived the study. AN and KK contributed to the study design. AN collected and analyzed the data and wrote the original graft. KK, SH, SO, and RN critically revised the manuscript. RN supervised the study. All the authors approved the final manuscript.
This study was conducted using publicly available government statistics, and personal information of the participants was not addressed. Therefore, this study did not require approval from the institutional review board of the respective institution.
Huang C, Wang Y, Li X, et al. Clinical features of patients infected with 2019 novel coronavirus in Wuhan, China. Lancet. 2020;395(10223):497-506.
Zhou F, Yu T, Du R, et al. Clinical course and risk factors for mortality of adult inpatients with COVID-19 in Wuhan, China: a retrospective cohort study. Lancet. 2020;395(10229):1054-62.
Wu D, Wu T, Liu Q, et al. The SARS-CoV-2 outbreak: what we know. Int J Infect Dis. 2020;94:44-8.
World Health Organization. Virtual press conference on COVID-19 - 11 March 2020 [Internet]. [cited 2023 Feb 28]. Available from: https://www.who.int/docs/default-source/coronaviruse/transcripts/who-audio-emergencies-coronavirus-press-conference-full-and-final-11mar2020.pdf?sfvrsn=%20cb432bb3_2.
World Health Organization. WHO coronavirus (COVID-19) dashboard [Internet]. [cited 2023 Feb 28]. Available from: https://covid19.who.int/.
Ministry of Health, Labour and Welfare. Visualizing the data: information on COVID-19 infections [Internet]. [cited 2023 Feb 28] Available from: https://covid19.mhlw.go.jp/en/.
Ogata T, Tanaka H. SARS-CoV-2 incubation period during the Omicron BA.5-dominant period in Japan. Emerg Infect Dis. 2023;29(3):595-8.
Cabinet Office Japan. Annual report on the ageing society [Summary] FY2021 [Internet]. [cited 2023 Feb 28]. Available from: https://www8.cao.go.jp/kourei/english/annualreport/2021/pdf/2021.pdf.
OECD (2021). “Trend in life expectancy” in Health at a Glance 2021: OECD Indicators [Internet]. [cited 2023 Feb 28]. Available from: https://www.oecd-ilibrary.org/docserver/e0d509f9-en.pdf?expires=1677937594&id=id&accname=guest&checksum=4130F1E68EBE9D2F330ED4337528F20F.
Reich MR, Ikegami N, Shibuya K, et al. 50 years of pursuing a healthy society in Japan. Lancet. 2011;378(9796):1051-3.
Matsuda S. Health policy in Japan - current situation and future challenges. JMA J. 2019;2(1):1-10.
Ishikawa T, Ohba H, Yokooka Y, et al. Forecasting the absolute and relative shortage of physicians in Japan using a system dynamics model approach. Hum Resour Health. 2013;11:41.
Kojin H, Inoue O, Kinouchi H. A study of the patient acceptance capacity of the Yamanashi prefecture medical system amid the coronavirus disease 2019 pandemic. JMA J. 2021;4(1):24-31.
Oda J, Tanabe S, Nishimura T, et al. JAAM Nationwide survey on the response to the first wave of COVID-19 in Japan. Part I: how to set up a treatment system in each hospital. Acute Med Surg. 2020;7(1):e614.
World Health Organization. Coronavirus disease (COVID-19): how is it transmitted? [Internet]. [cited 2023 Feb 28]. Available from: https://www.who.int/news-room/questions-and-answers/item/coronavirus-disease-covid-19-how-is-it-transmitted.
Han E, Tan MMJ, Turk E, et al. Lessons learnt from easing COVID-19 restrictions: an analysis of countries and regions in Asia Pacific and Europe. Lancet. 2020;396(10261):1525-34.
Kandel N, Chungong S, Omaar A, et al. Health security capacities in the context of COVID-19 outbreak: an analysis of International Health Regulations annual report data from 182 countries. Lancet. 2020;395(10229):1047-53.
Ministry of Health, Labour and Welfare. Regional healthcare policy [Internet]. [cited 2023 Feb 28]. Available from: https://www.mhlw.go.jp/stf/seisakunitsuite/bunya/kenkou_iryou/iryou/iryou_keikaku/index.html.
Ministry of Health, Labour and Welfare. The 2021 survey of medical institutions [Internet]. [cited 2023 Feb 28]. Available from: https://www.mhlw.go.jp/toukei/list/79-1.html.
Statistics Bureau of Japan. The 2020 population census of Japan. [Internet]. [cited 2023 Feb 28]. Available from: https://www.stat.go.jp/english/data/kokusei/index.html.
Nagai R. New infection rates by age group and prefecture, adjusted for population, as shown in the graph: Takemi Foundation COVID-19 Expert Panel. [Internet]. [cited 2023 Mar 16]. Available from: https://www.covid19-jma-medical-expert-meeting.jp/topic/7400. Japanese.
Ferrara N, Campobasso CP, Cocozza S, et al. Relationship between COVID-19 mortality, hospital beds, and primary care by Italian regions: a lesson for the future. J Clin Med. 2022;11(14):4196.
Hong D, Lee S, Choi YJ, et al. The age-standardized incidence, mortality, and case fatality rates of COVID-19 in 79 countries: a cross-sectional comparison and their correlations with associated factors. Epidemiol Health. 2021;43:e2021061.
Mattiuzzi C, Lippi G, Henry BM. Healthcare indicators associated with COVID-19 death rates in the European Union. Public Health. 2021;193:41-2.
Oliva C, Di Maddaloni F, Marcellusi A, et al. Cross-regional variations of Covid-19 mortality in Italy: an ecological study. J Public Health (Oxf). 2021;43(2):261-9.
Shallcross L, Burke D, Abbott O, et al. Factors associated with SARS-CoV-2 infection and outbreaks in long-term care facilities in England: a national cross-sectional survey. Lancet Healthy Longev. 2021;2(3):e129-42.
Webster P. COVID-19 highlights Canada‘s care home crisis. Lancet. 2021;397(10270):183.
Williamson EJ, Walker AJ, Bhaskaran K, et al. Factors associated with COVID-19-related death using OpenSAFELY. Nature. 2020;584(7821):430-6.
Dadras O, SeyedAlinaghi S, Karimi A, et al. COVID-19 mortality and its predictors in the elderly: a systematic review. Health Sci Rep. 2022;5(3):e657.
Ministry of Health, Labour and Welfare. The 2020 statistics of physicians, dentists and pharmacists [Internet]. [cited 2023 Feb 28]. Available from: https://www.mhlw.go.jp/toukei/saikin/hw/ishi/20/index.html.
Ministry of Health, Labour and Welfare. The 2020 survey of institutions and establishments for long-term care [Internet]. [cited 2023 Feb 28]. Available from: https://www.mhlw.go.jp/toukei/list/24-22-2.html.
Ministry of Health, Labour and Welfare. The 2020 survey of social welfare institutions [Internet]. [cited 2023 Feb 28]. Available from: https://www.mhlw.go.jp/toukei/list/23-22.html.
Osaki Y, Otsuki H, Imamoto A, et al. Why are COVID-19 mortality rates by country or region so different?: an ecologic study of factors associated with mortality from novel coronavirus infections by country. Yonago Acta Med. 2021;64(1):80-91.
Barrera-Algarín E, Estepa-Maestre F, Sarasola-Sánchez-Serrano JL, et al. [COVID-19, neoliberalismo y sistemas sanitarios en 30 países de Europa: repercusiones en el número de fallecidos]. Rev Esp Salud Publica. 2020;94:e202010140. Spanish.
Sen-Crowe B, Sutherland M, McKenney M, et al. A closer look into global hospital beds capacity and resource shortages during the COVID-19 pandemic. J Surg Res. 2021;260:56-63.
OECD (2021). “Indicator overview: country dashboard and major trends”, in Health at a Glance 2021: OECD Indicators [Internet]. [cited 2023 Feb 28]. Available from: https://www.oecd-ilibrary.org/docserver/919b5f62-en.pdf?expires=1677937219&id=id&accname=guest&checksum=1AE3A22D3B78D40091B8F1F0E966AC75.
Elkrief A, Desilets A, Papneja N, et al. High mortality among hospital-acquired COVID-19 infection in patients with cancer: a multicentre observational cohort study. Eur J Cancer. 2020;139:181-7.
Ponsford MJ, Ward TJC, Stoneham SM, et al. A systematic review and meta-analysis of inpatient mortality associated with nosocomial and community COVID-19 exposes the vulnerability of immunosuppressed adults. Front Immunol. 2021;12:744696.
Tauffer J, Konstantyner TCRO, de Almeida MCS, et al. Impact of in-hospital infection with SARS-CoV-2 among Inpatients at a university hospital. Am J Infect Control. 2021;49(12):1464-8.
Tochigi prefecture. About cluster occurrence situation in the prefecture [Internet]. [cited 2023 Feb 28]. Available from: https://www.pref.tochigi.lg.jp/e04/welfare/hoken-eisei/kansen/hp/documents/20230222kurasuta.pdf.
Gunma Prefecture. About cluster occurrence situation in the prefecture [Internet]. [cited 2023 Feb 28]. Available from: https://www.pref.gunma.jp.e.aag.hp.transer.com/site/covid19/2676.html.
Japan Health Policy NOW. Regional medical care delivery system maintenance [Internet]. [cited 2023 Feb 28]. Available from: https://japanhpn.org/ja/section4-4/.
Portmann L, de Kraker MEA, Fröhlich G, et al. Hospital outcomes of community-acquired SARS-CoV-2 Omicron variant infection compared with influenza infection in Switzerland. JAMA Netw Open. 2023;6(2):e2255599.
Kodera S, Rashed EA, Hirata A. Correlation between COVID-19 morbidity and mortality rates in Japan and local population density, temperature, and absolute humidity. Int J Environ Res Public Health. 2020;17(15):5477.
