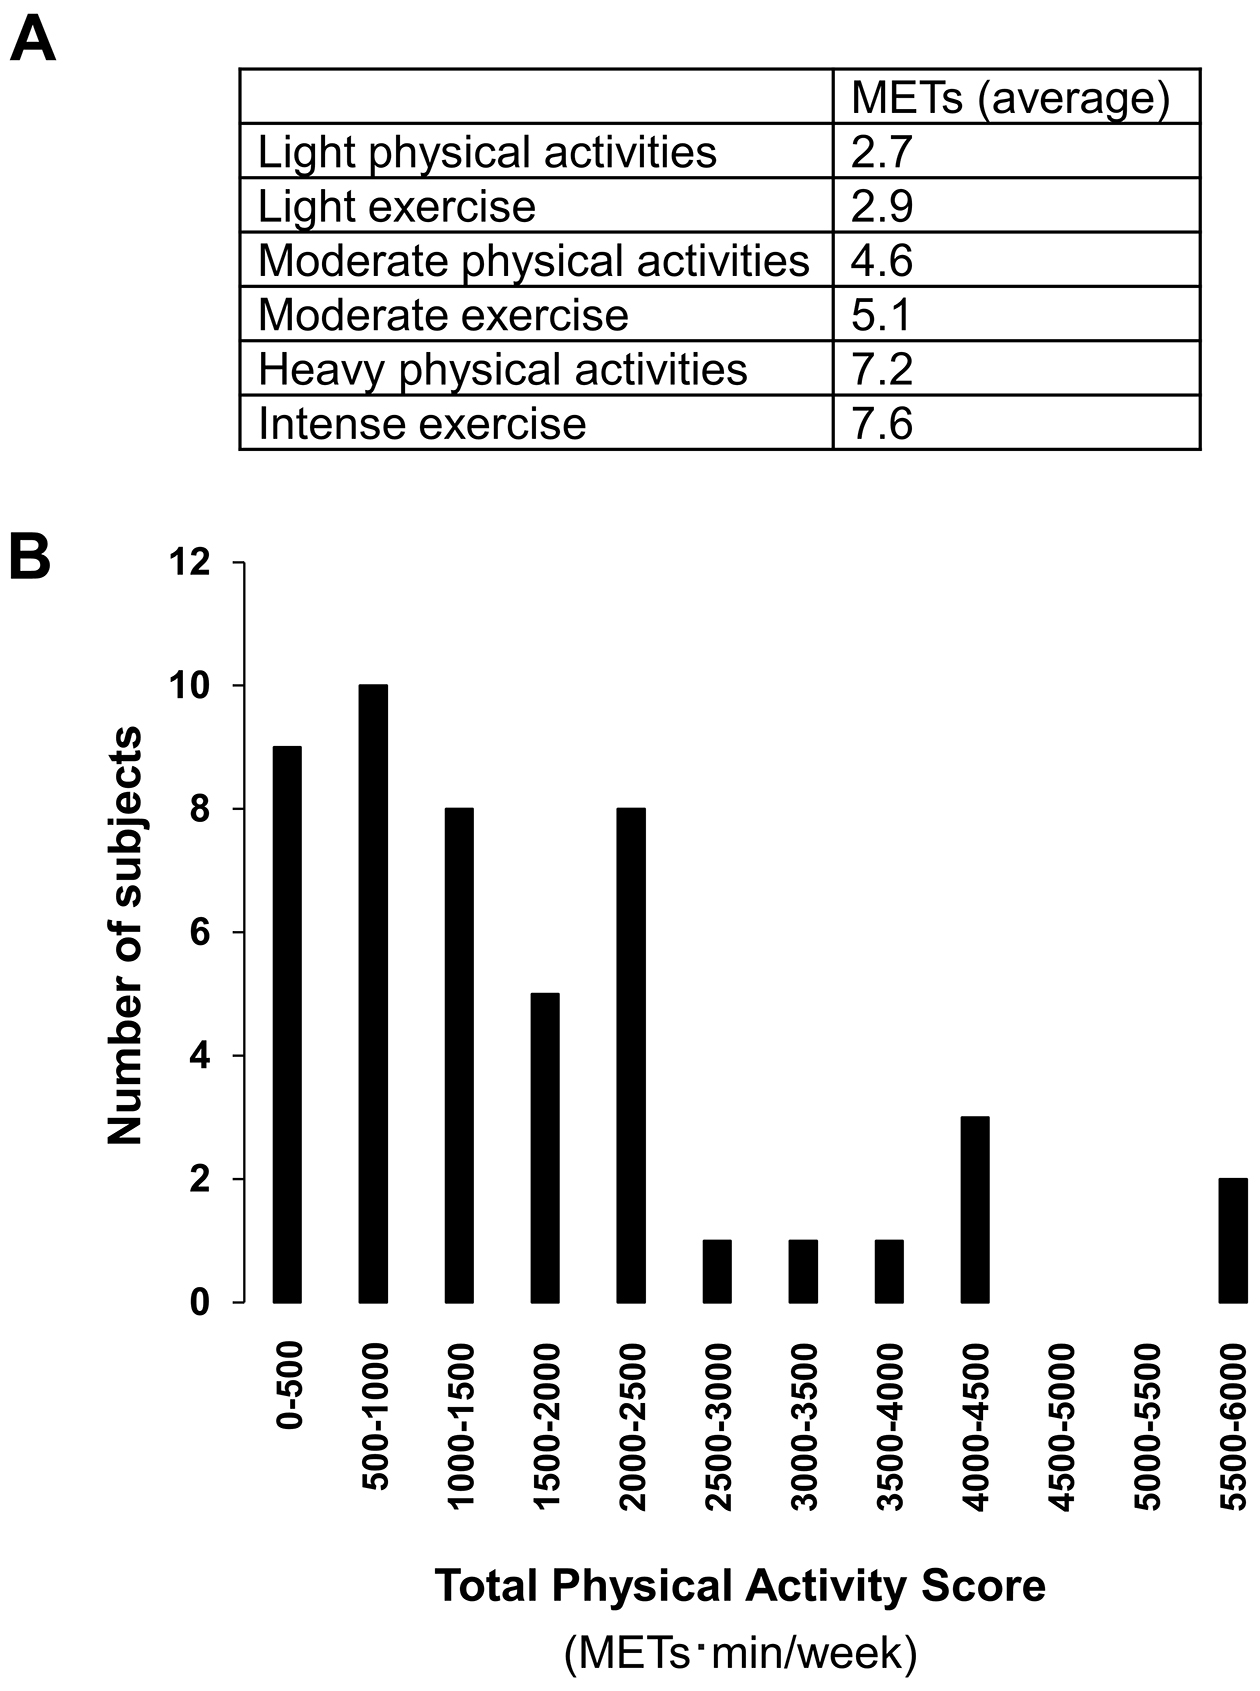
Figure 1. Total Physical Activity Scores
A. Averaged METs of physical activities for calculating Total Physical Activity Score
B. A histogram of Total Physical Activity Scores (METs·min/week) of 48 participants calculated as 2.7 (METs) × frequency of light physical activity (/week) × duration (min) + 2.9 (METs) × frequency of light exercise (/week) × duration (min) + 4.6 (METs) × frequency of moderate physical activity (/week) × duration (min) + 5.1 (METs) × frequency of moderate exercise (/week) × duration (min) + 7.2 (METs) × frequency of heavy physical activity (/week) × duration (min) + 7.6 (METs) × frequency of intense exercise (/week) × duration (min).
From: Development of Modified Japanese Versions of Questionnaires to Assess Physical and Cognitively Stimulating Activities