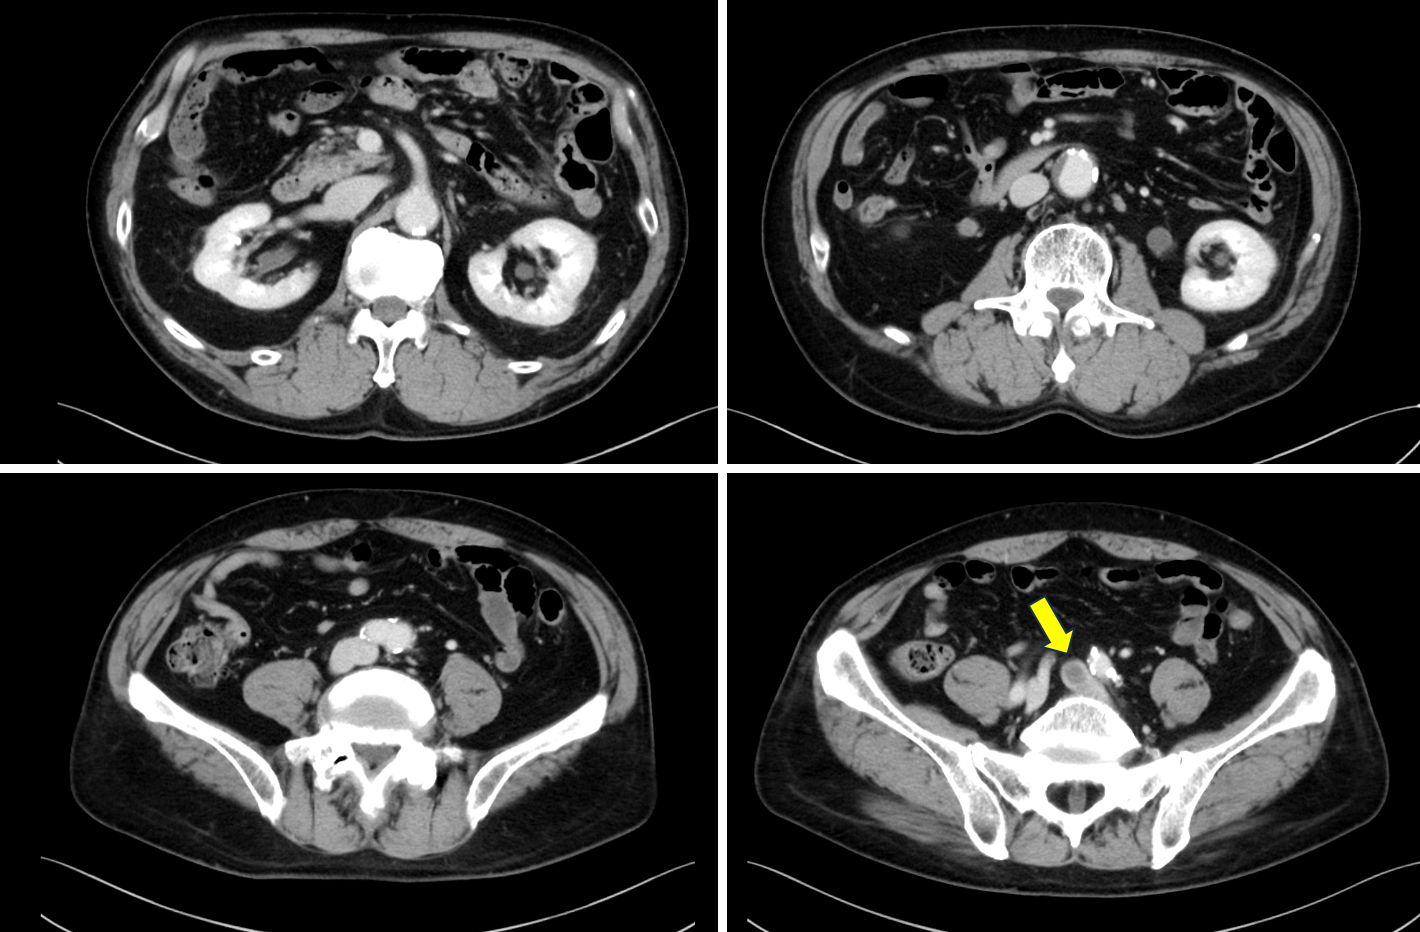
Figure 1. Contrast-enhanced computed tomography showing a calcified thrombus (yellow arrow) extending from the inferior vena cava to the left common iliac vein in axial images (A - D) and coronal images (E, F).
From: Venous Thrombus Calcification over Time
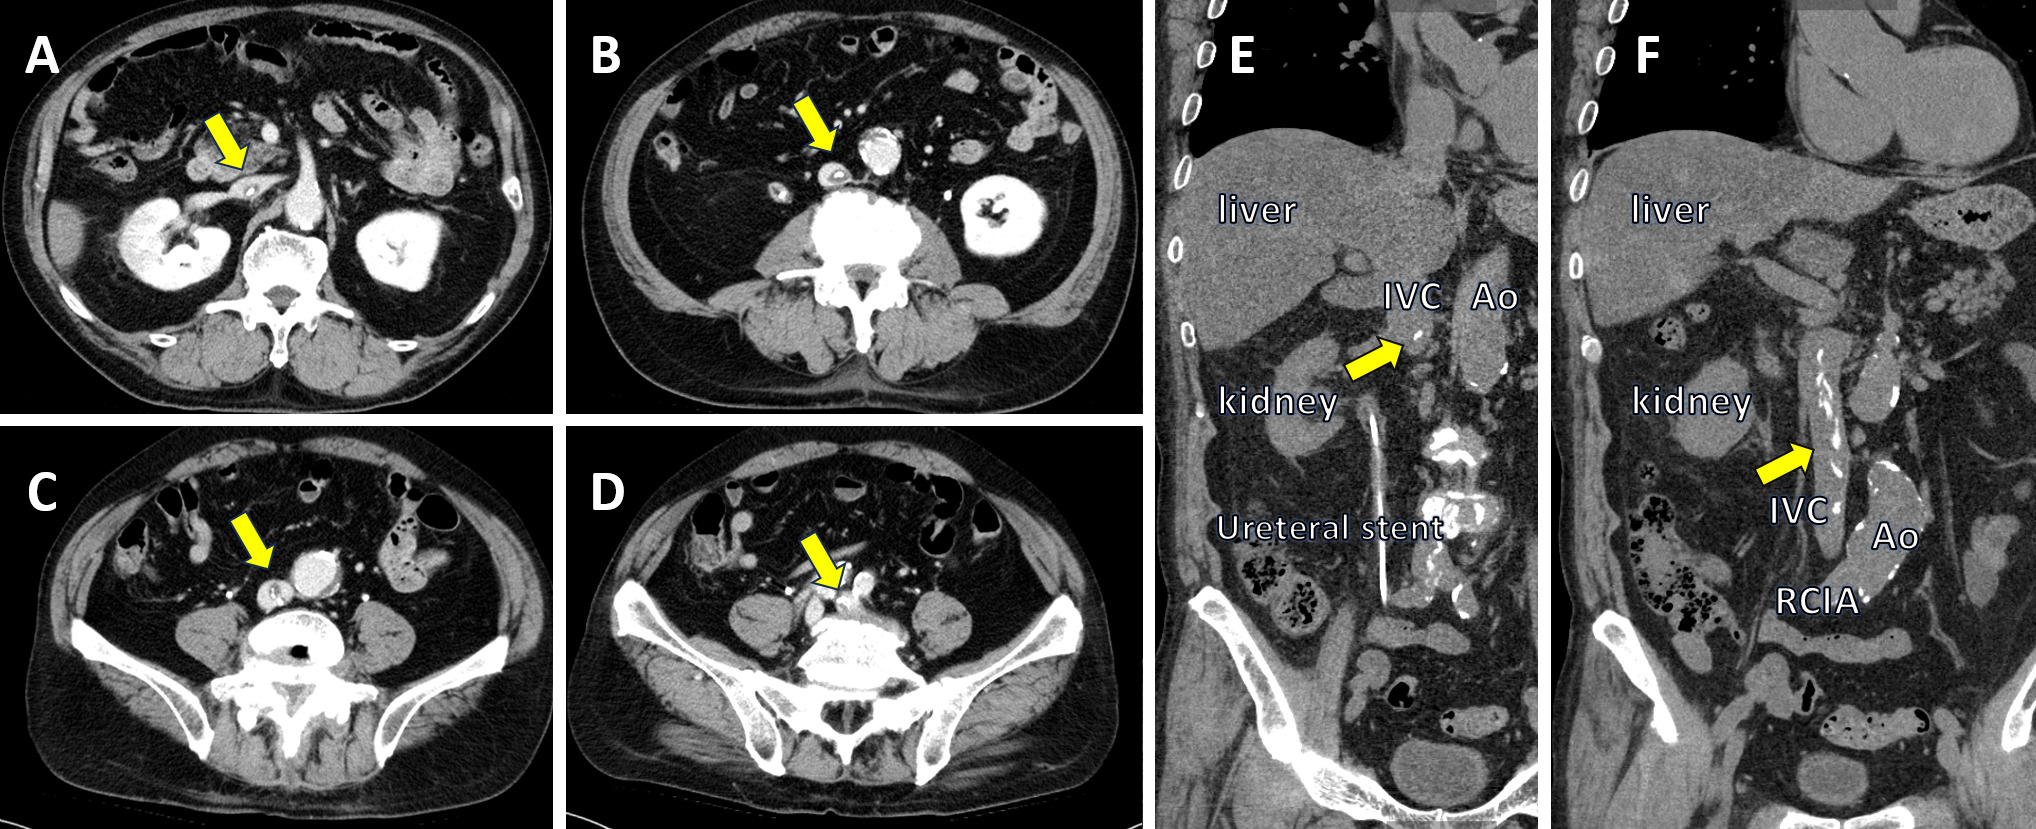
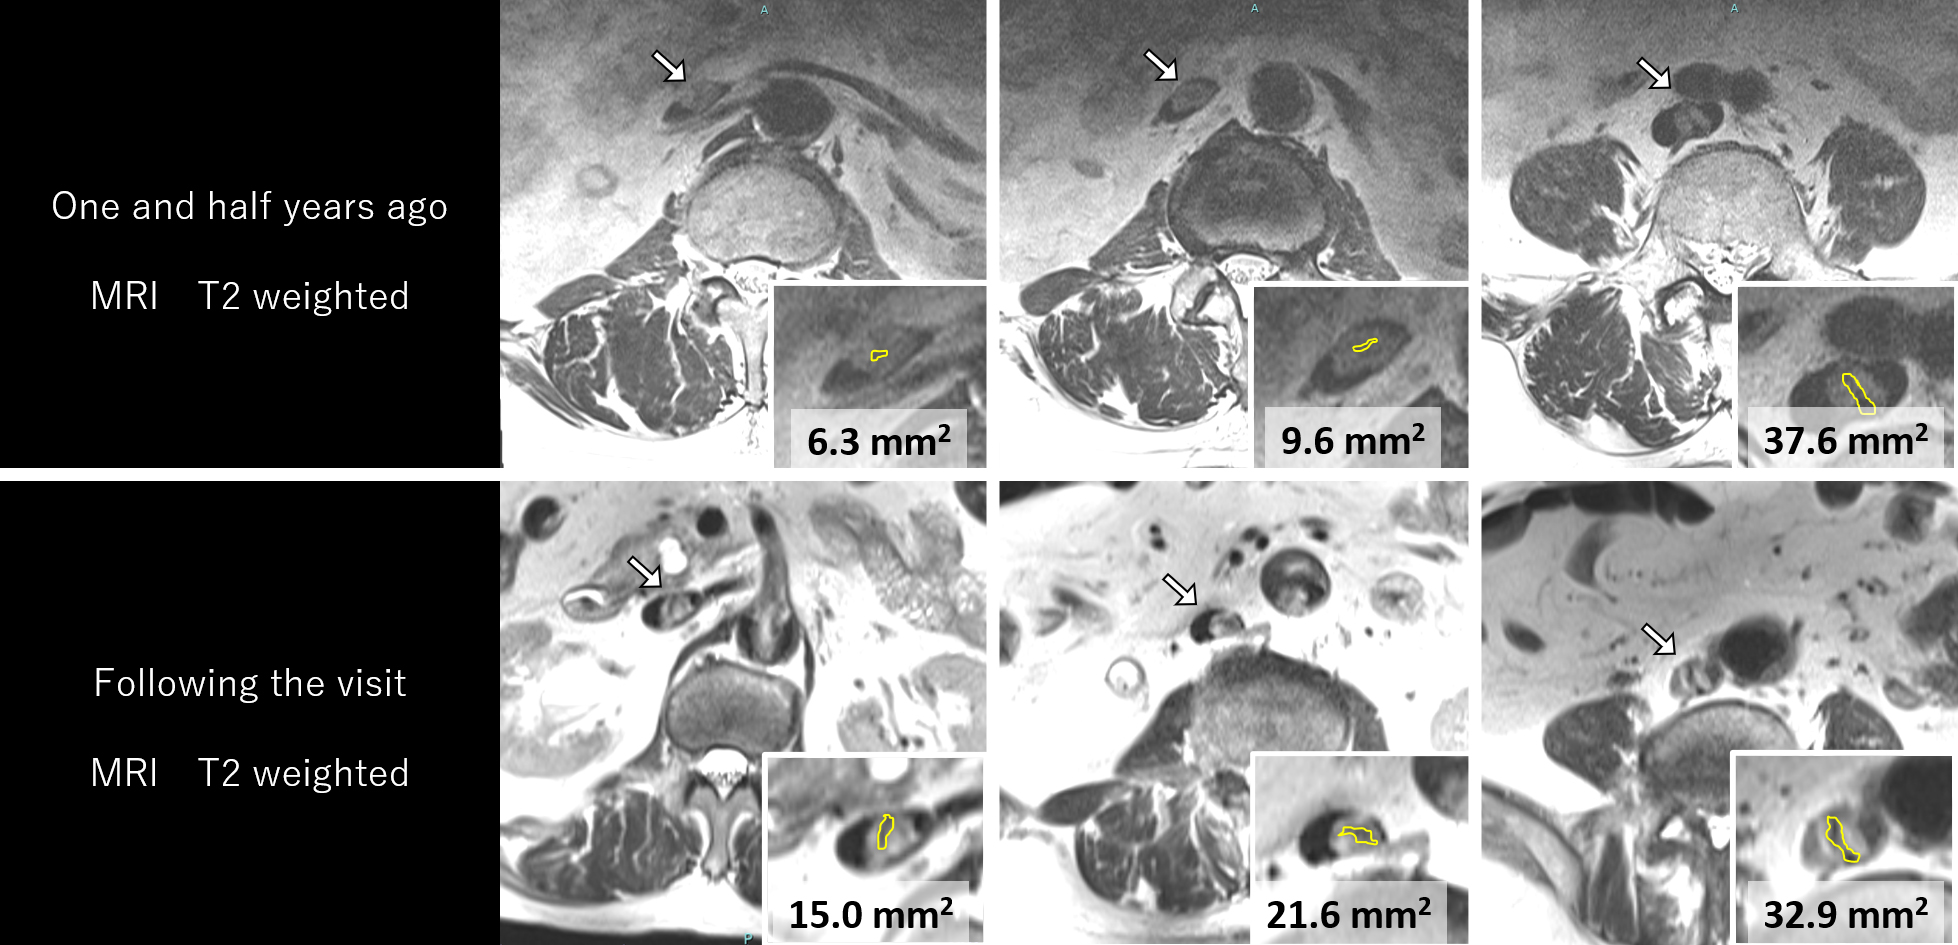
Figure 3. Increasing the low-intensity area (yellow enclosure and area value) over time by comparing magnetic resonance imaging performed 18 months ago and the day following the visit.
From: Venous Thrombus Calcification over Time