Home
Advance Publications
Issues
Instructions for Authors
Guidelines
Submission
Editors & Publishers
Acknowledgement
JMA Journal
Home
Advance Publications
Issues
Instructions for Authors
Guidelines
Submission
Editors & Publishers
Acknowledgement
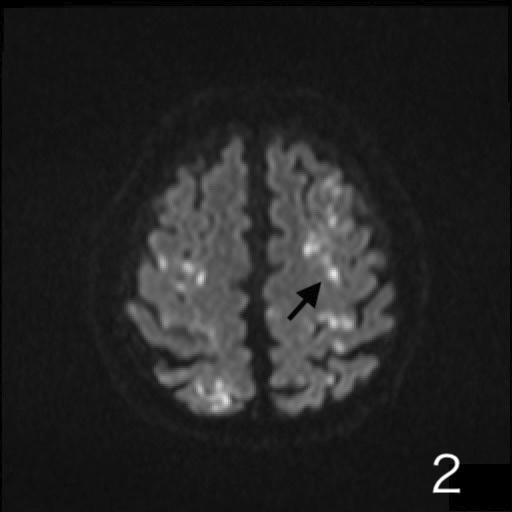
Figure 1.
Left femoral shaft on 1
st
day.
From:
Cerebral Fat Embolism Syndrome
» Back to article page
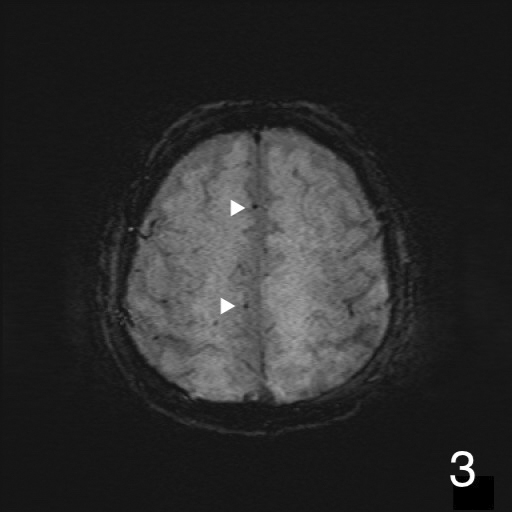
Figure 2.
Axial DWI images on 3
rd
day showing scattered hyper intense signal consistent with starfield pattern at cerebral hemisphere.
From:
Cerebral Fat Embolism Syndrome
» Back to article page
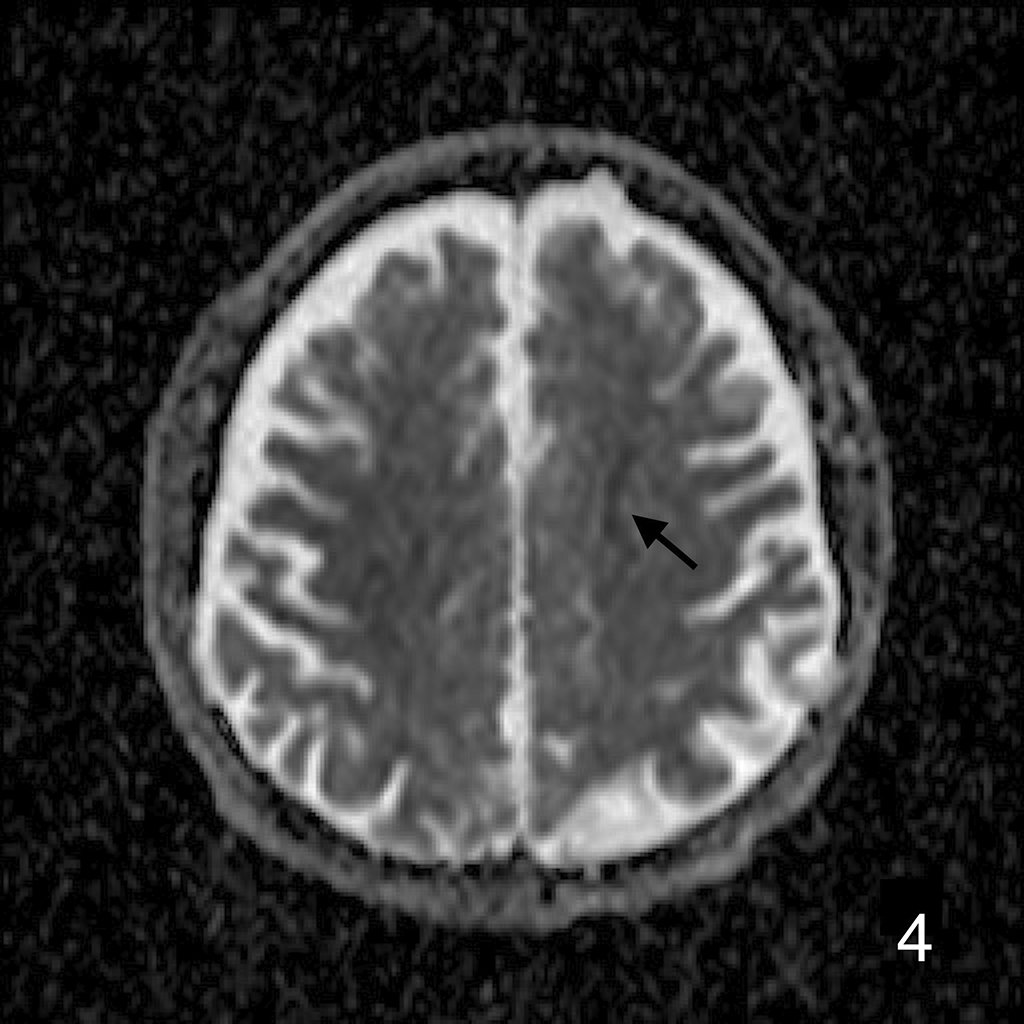
Figure 3.
Axial SWI images on 3
rd
day showing numerous petechial hemorrhages at cerebral hemisphere.
From:
Cerebral Fat Embolism Syndrome
» Back to article page
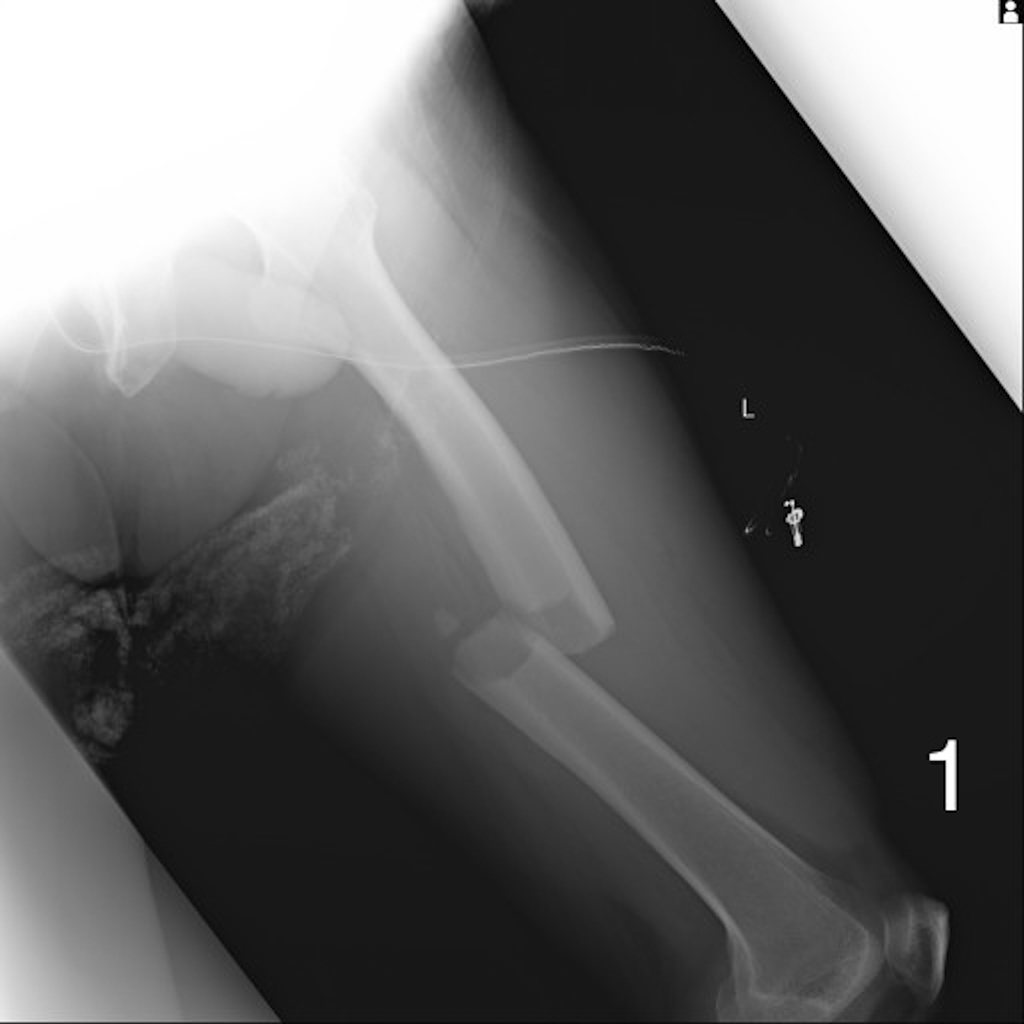
Figure 4.
Axial DWI-ADC images on 3
rd
day shows restriction at cerebral hemisphere.
From:
Cerebral Fat Embolism Syndrome
» Back to article page
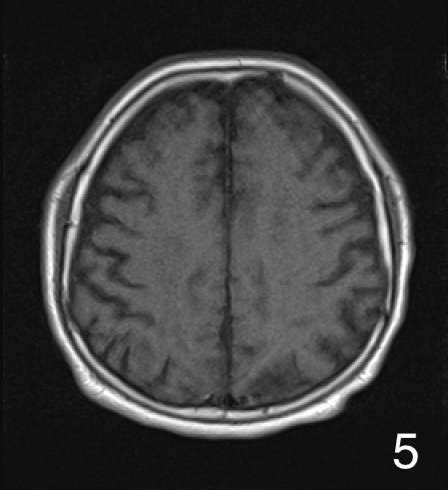
Figure 5.
Axial T1-tra images on 3
rd
day.
From:
Cerebral Fat Embolism Syndrome
» Back to article page
©
Japan Medical Association
. All rights reserved.