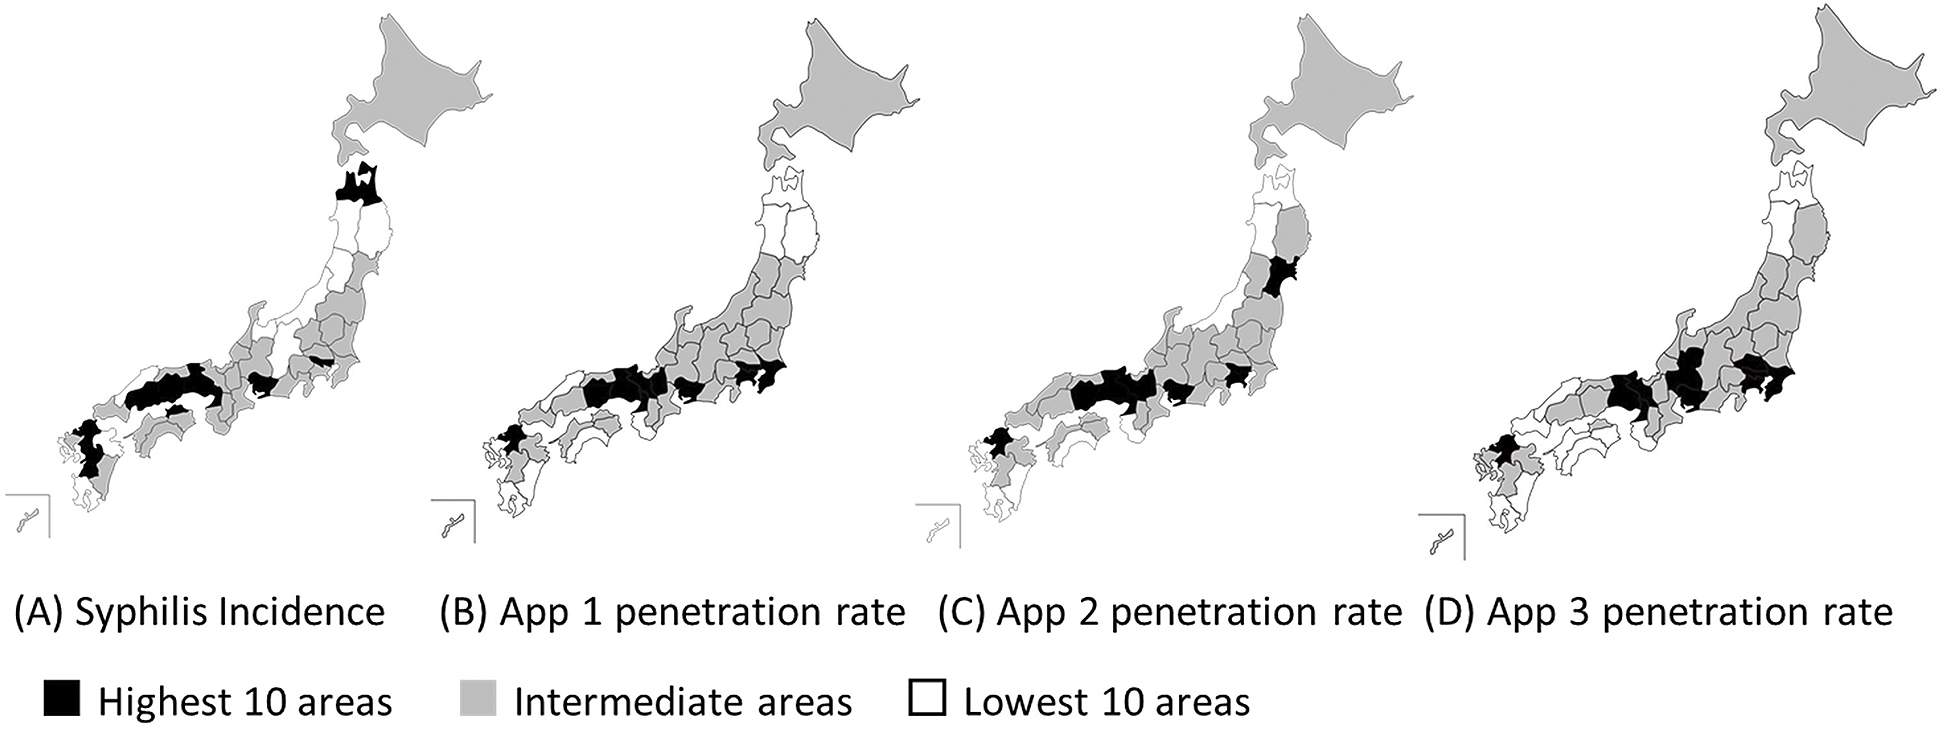
Figure 1. Map A indicates prefectural differences in the annual incidence of syphilis in 2017, while maps B, C, and D show penetration rates of each dating app. Prefectures are classified into three categories: the lowest 10 (white areas), the highest 10 (black areas), and intermediate (gray areas).
From: Association between Syphilis Incidence and Dating App Use in Japan