Figure 1. Flow diagram of the study design.
The flow diagram of the study and the number of study participants are shown. QS: Questionnaire survey, ToMMo: Tohoku Medical Megabank Organization, TUH: Tohoku University Hospital.

From: A Pilot Study for Return of Individual Pharmacogenomic Results to Population-Based Cohort Study Participants

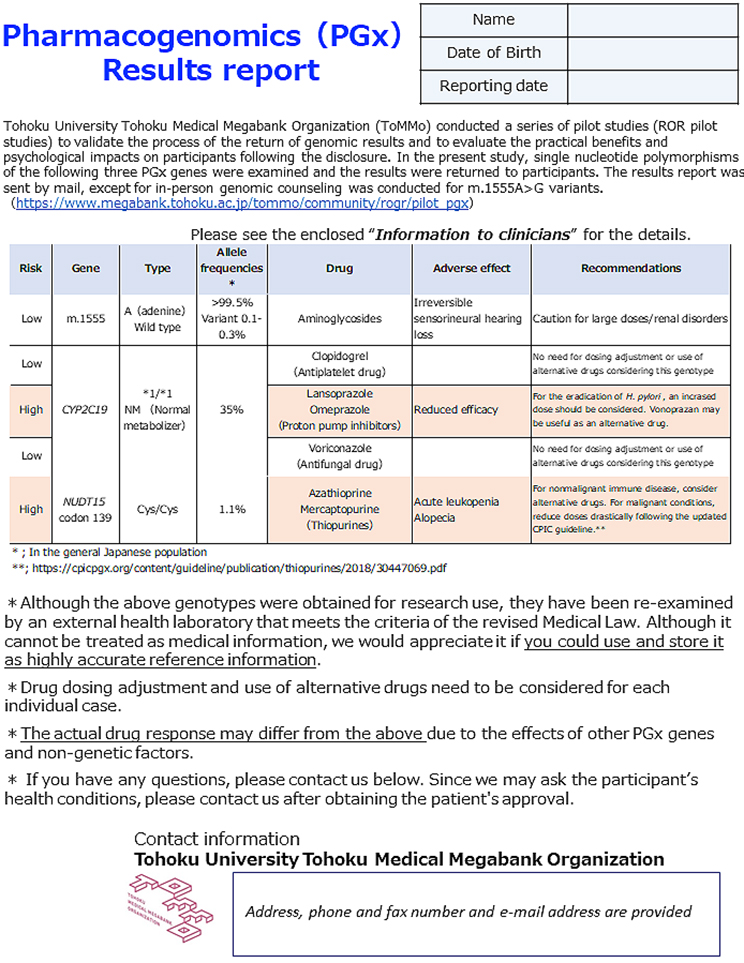
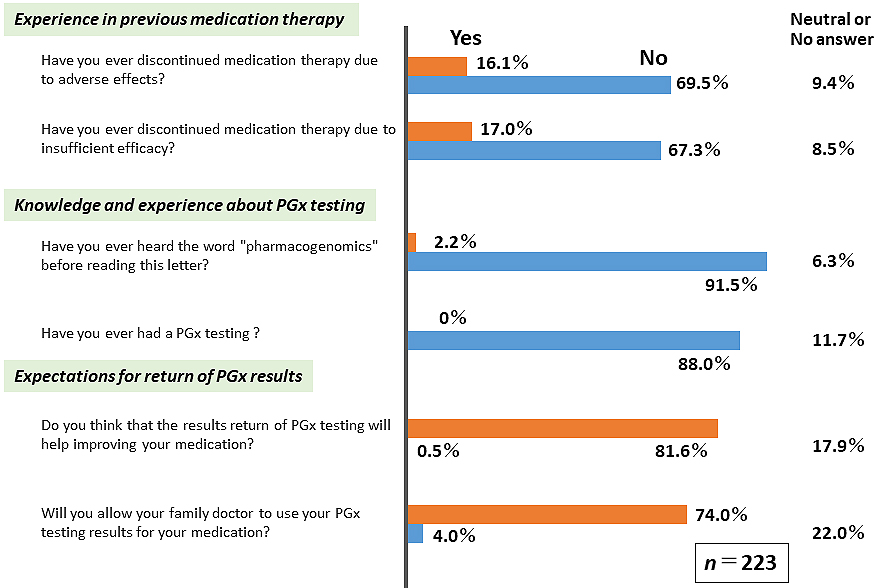
Figure 2. Results report for research participants sent via mail.
English translation of representative results reports for participants carrying a CYP2C19 variant [poor metabolizer (PM)]. A, Page 1 (of 6 pages) of the report shows drugs that can be influenced by the presence of specific CYP2C19 polymorphisms. B, Page 2 of the results report shows detailed medicinal information and drug response with regard to metabolism status. Participants were advised to take the enclosed information to healthcare professionals, as necessary.

From: A Pilot Study for Return of Individual Pharmacogenomic Results to Population-Based Cohort Study Participants

Figure 3. Summary results report for clinicians.
English translation of the representative results. The PGx results for genes are given in a table along with prescription recommendations. Information about the pilot study is included and accessible through the provided URL link along with the contact information included at the bottom of the report. Contact information is hidden for the manuscript.

From: A Pilot Study for Return of Individual Pharmacogenomic Results to Population-Based Cohort Study Participants

Figure 4. Questionnaire survey results before returning the genomic results.
The questionnaire survey results regarding past experience and problems with medication, knowledge of PGx, and expectations of PGx results are shown. The questionnaire was administered during the study recruitment phase, and answers were obtained from 223 participants, including seminar non-attendants.

From: A Pilot Study for Return of Individual Pharmacogenomic Results to Population-Based Cohort Study Participants

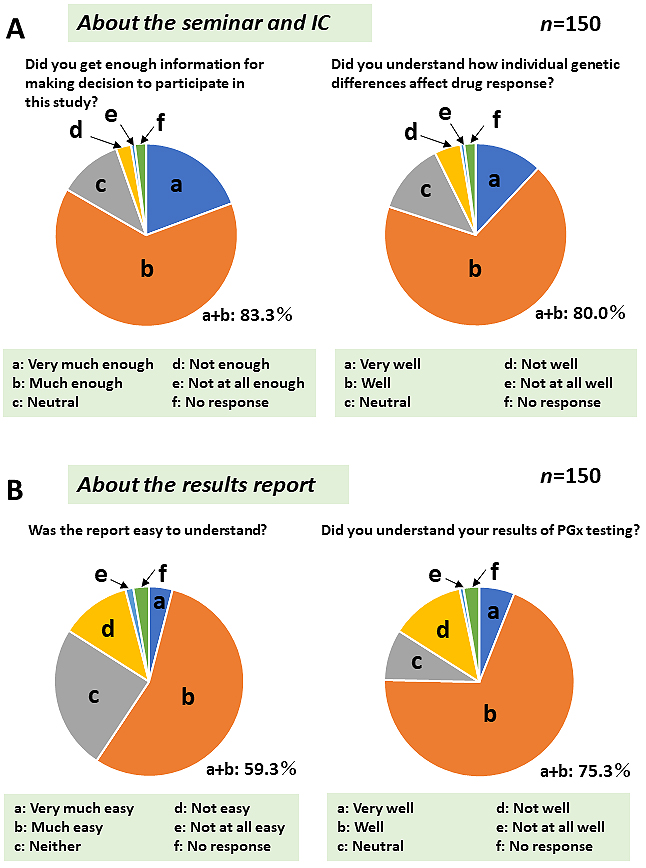
Figure 5. Questionnaire survey results after returning the genomic results.
The questionnaire survey results regarding seminar and IC (A) and the results report (B) content comprehension are presented. The boxes at the bottom of each pie chart show the survey choices (a-f). Answers were obtained from 150 subjects who participated in the study. The percentage of the participants choosing answers A or B is shown at the bottom right.

From: A Pilot Study for Return of Individual Pharmacogenomic Results to Population-Based Cohort Study Participants

PAGE TOP