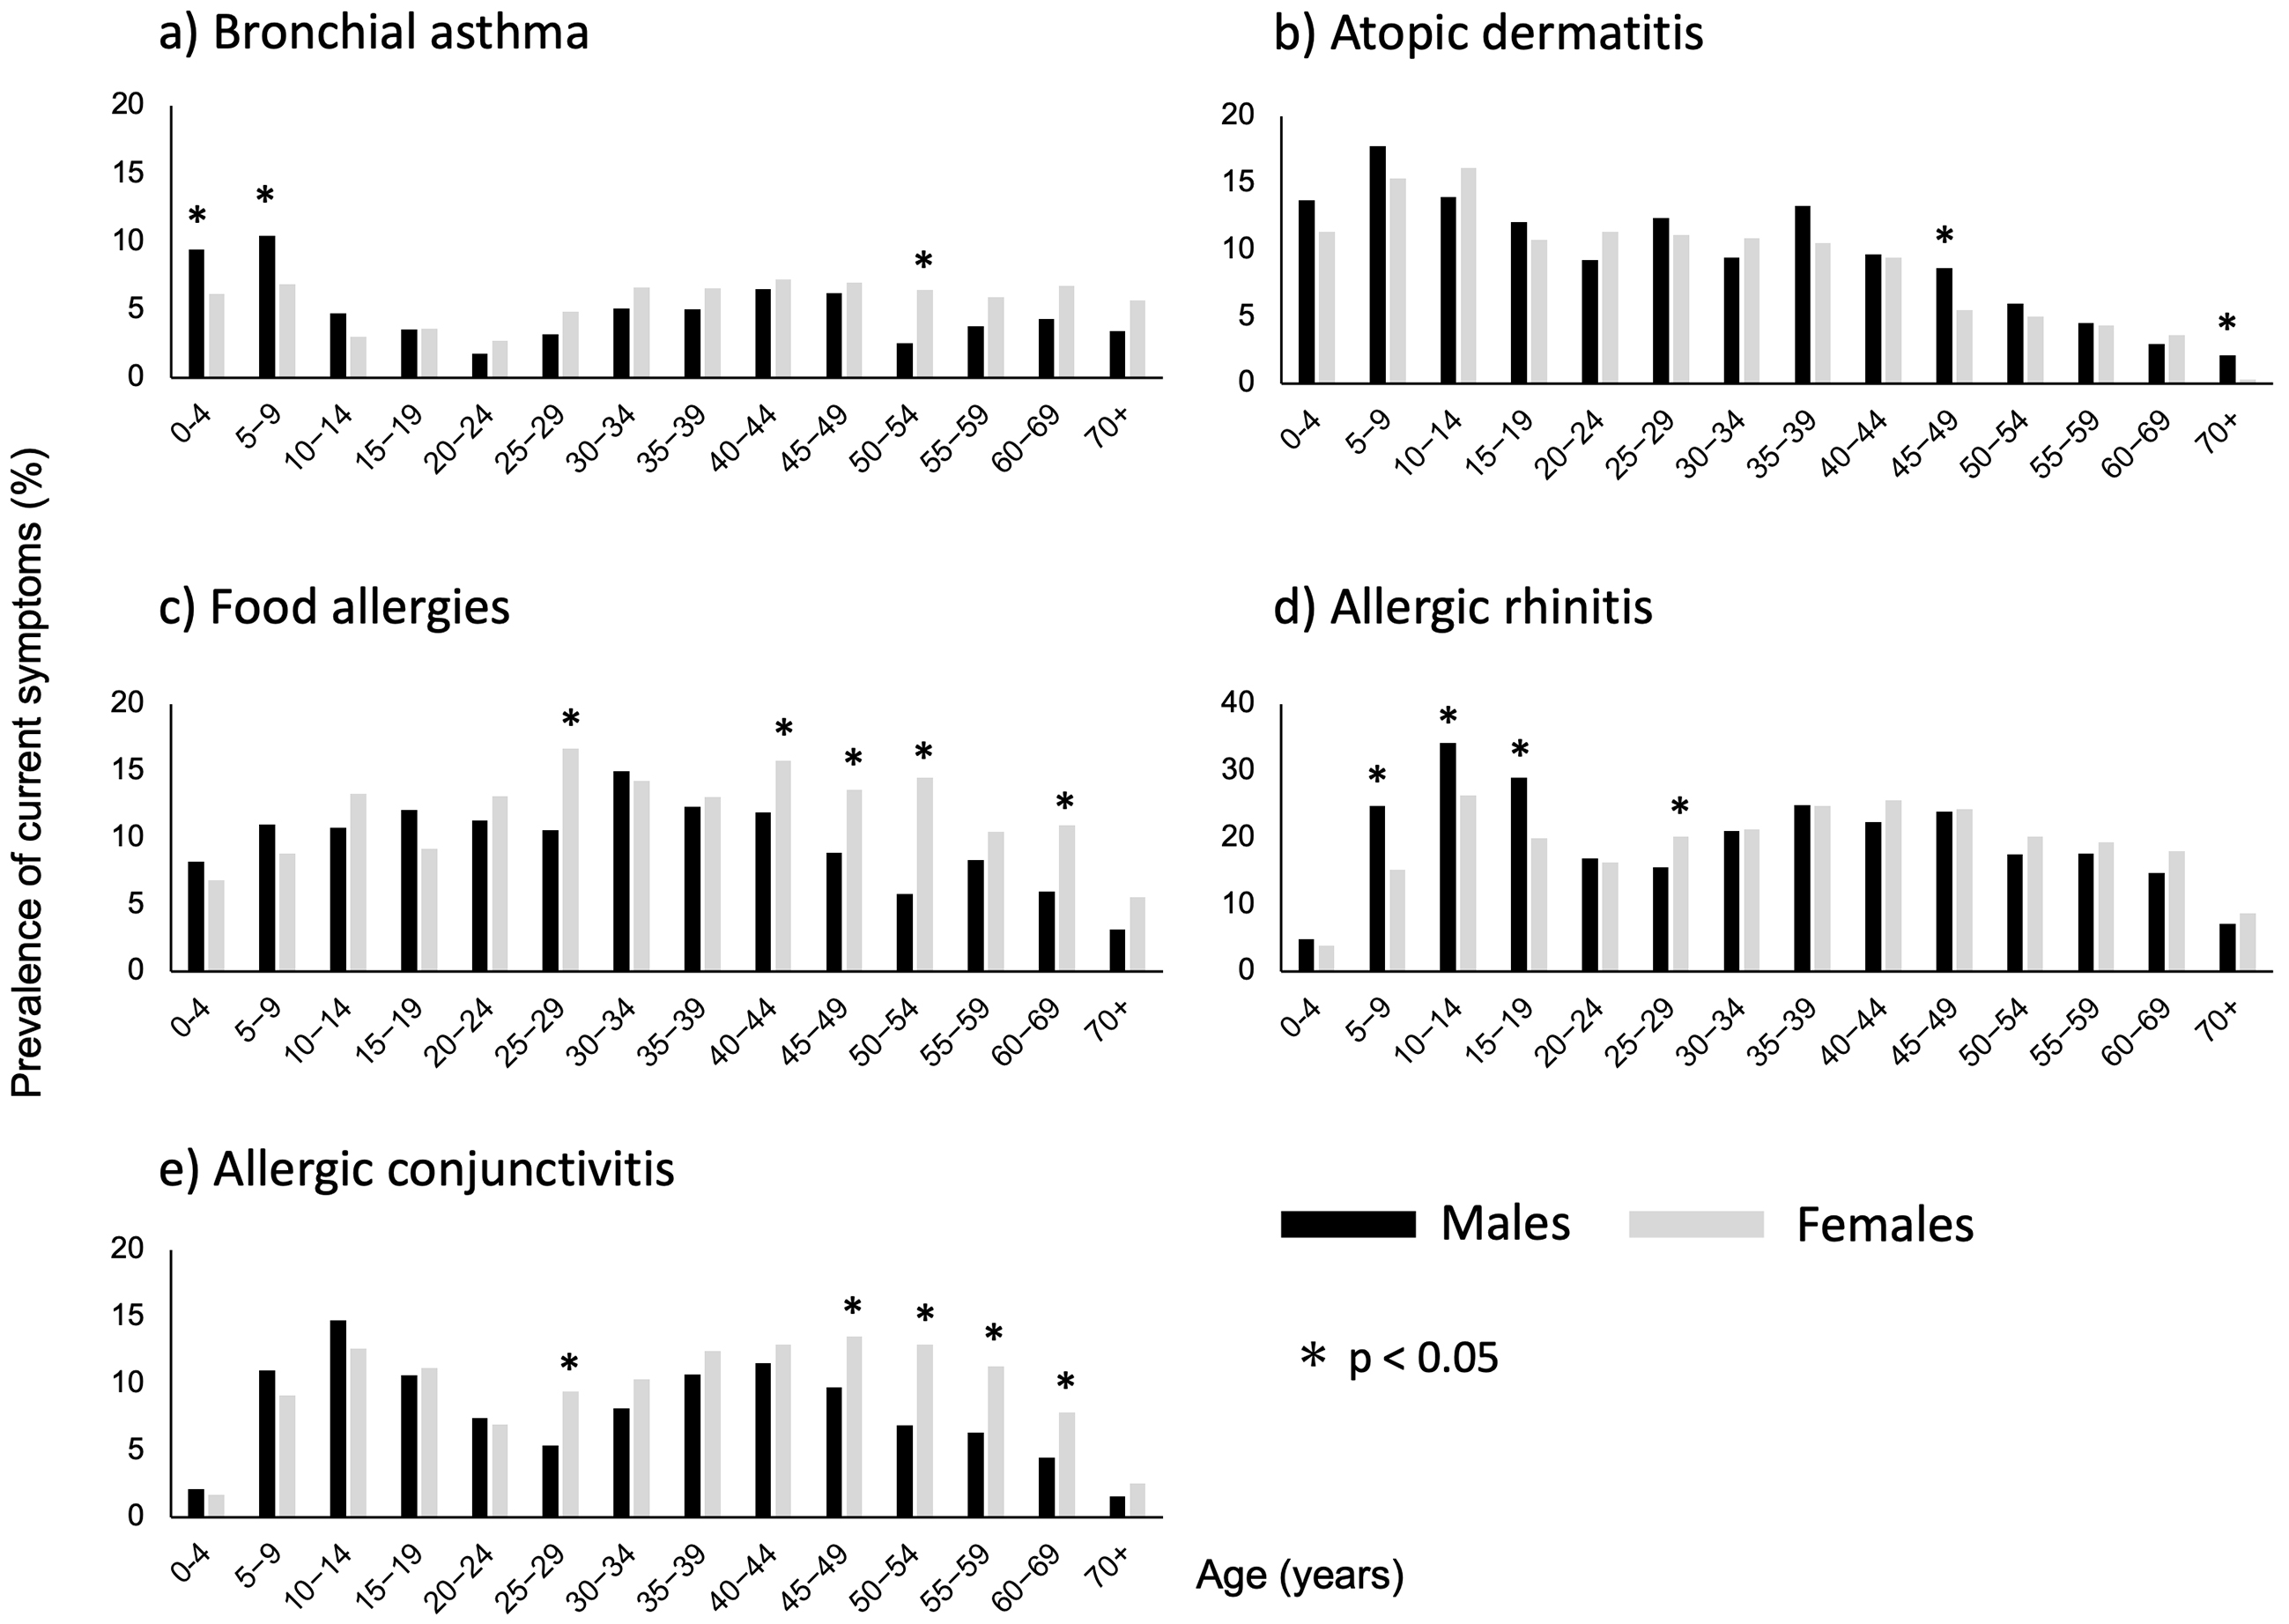
Figure 1. Prevalence of current symptoms of allergic diseases. The percentage of respondents who reported current symptoms of allergic diseases. a) Bronchial asthma, b) Atopic dermatitis, c) Food allergies, d) Allergic rhinitis, e) Allergic conjunctivitis P-values for sex differences in each age category were calculated using the chi-squared test.
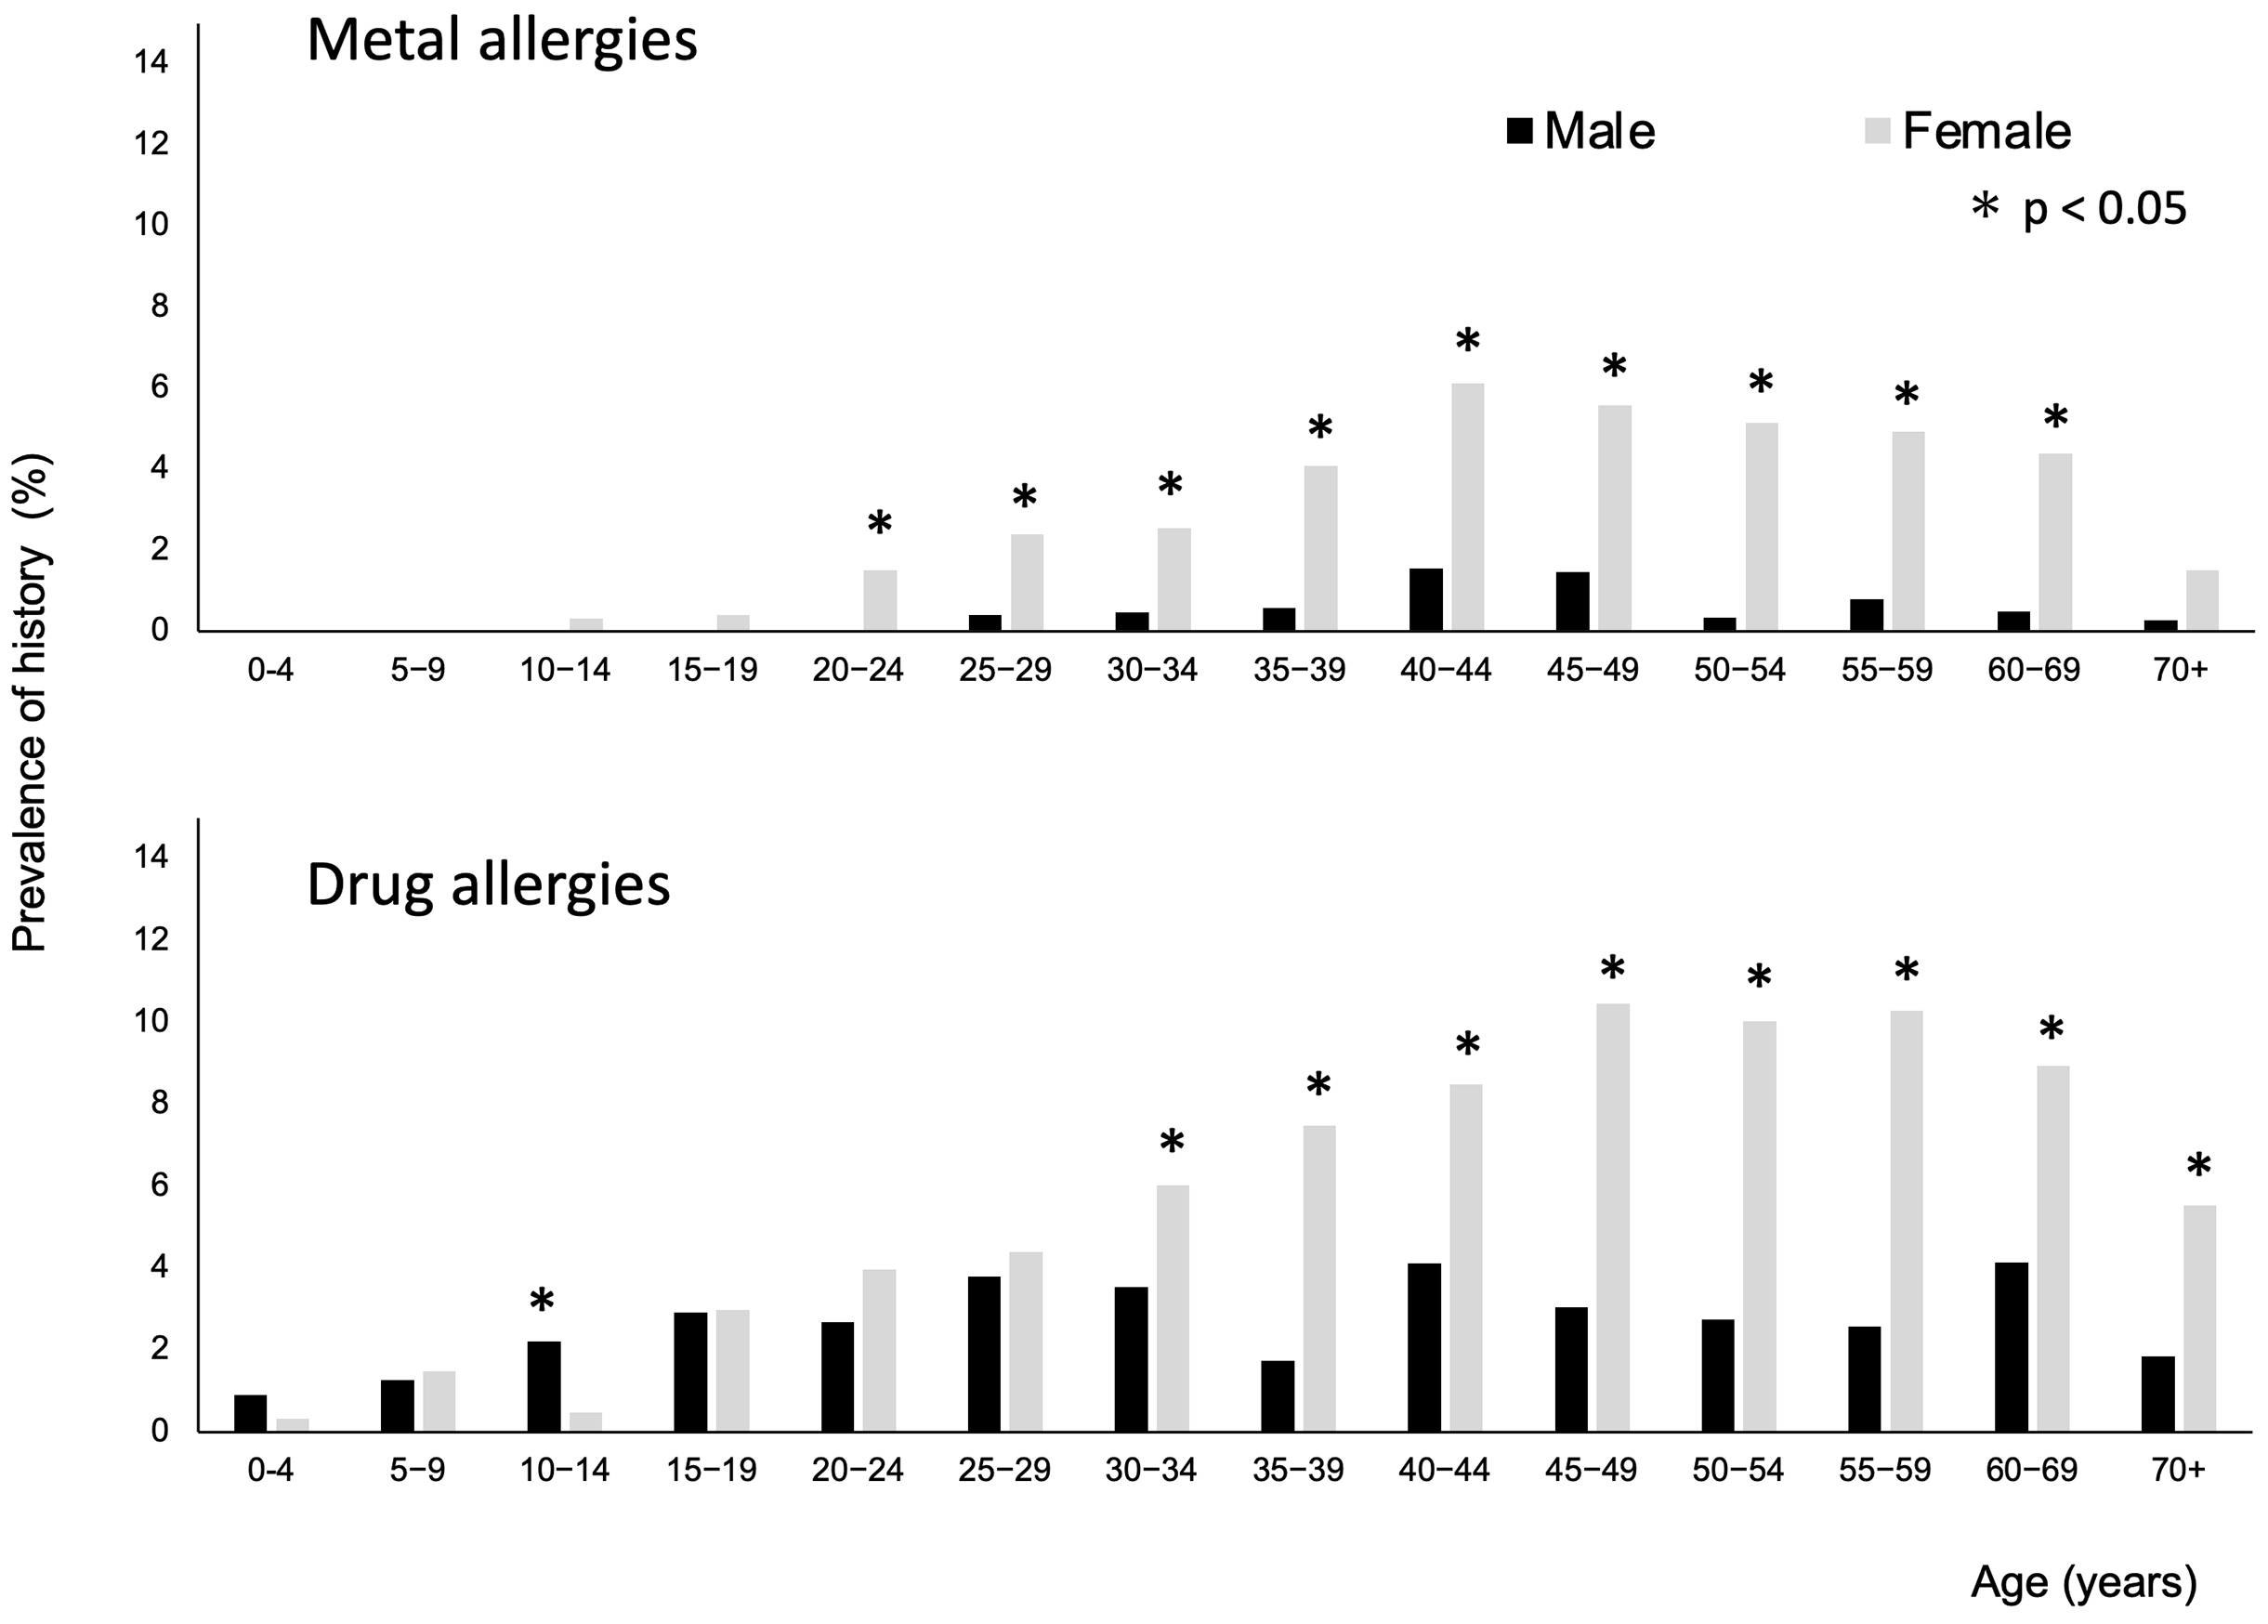
Figure 2. Prevalence of histories of metal and drug allergies. The percentage of respondents who reported a prevalence of histories of metal or drug allergies. P-values for sex differences in each age category were calculated using the chi-squared test.
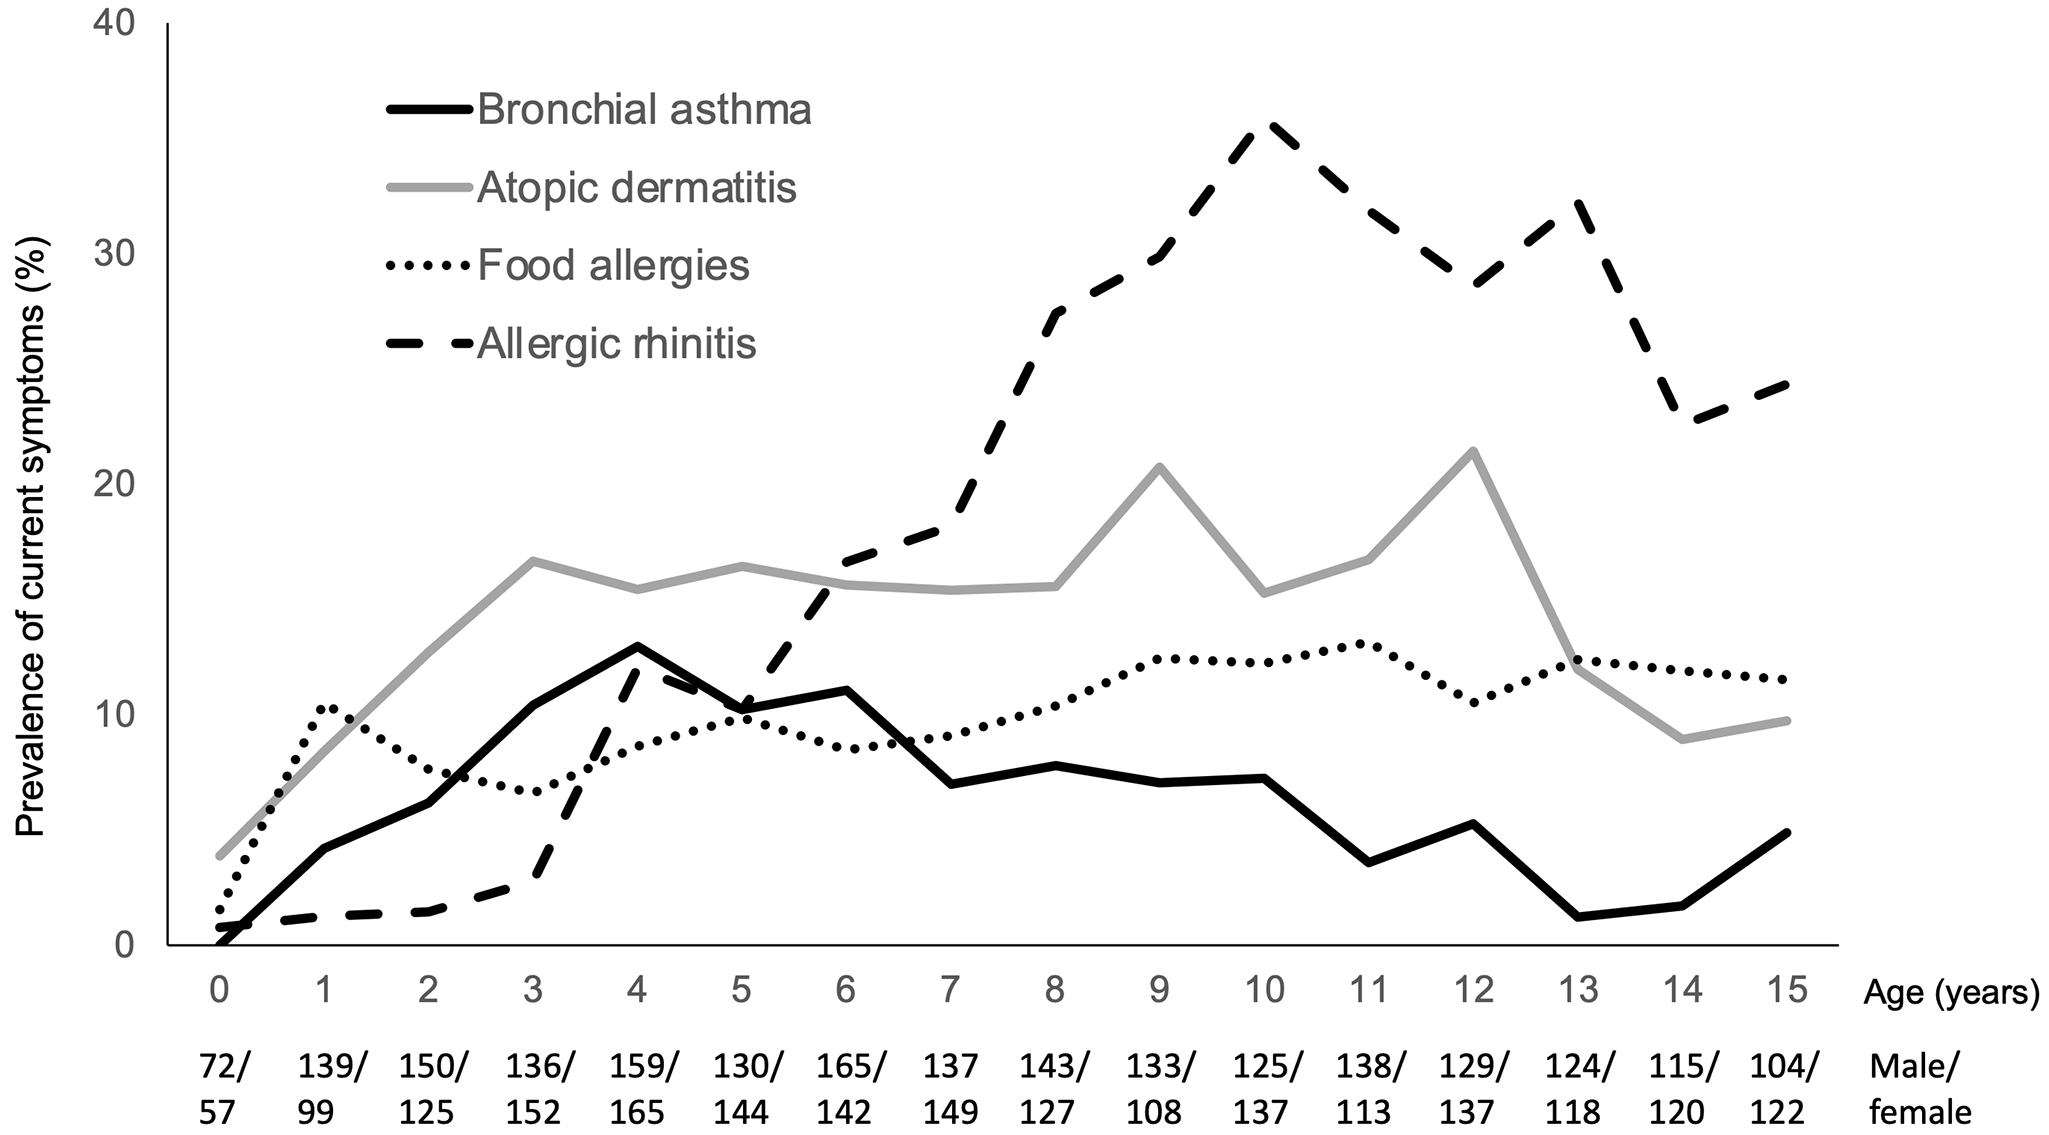
Figure 3. Allergic marches in children. Percentage of respondents who reported current symptoms of bronchial asthma, atopic dermatitis, food allergy, or allergic rhinitis in each age group from 0 to 15 years. The numbers of male and female respondents in each age group are shown below.