Corresponding author: Yuichi Adachi, yadachi@med.u-toyama.ac.jp
DOI: 10.31662/jmaj.2022-0218
Received: December 12, 2022
Accepted: December 28, 2022
Advance Publication: March 24, 2023
Published: April 14, 2023
Cite this article as:
Ito Y, Kato T, Yoshida K, Takahashi K, Fukutomi Y, Nagao M, Fukuie T, Matsuzaki H, Gotoh M, Tanaka A, Konno S, Tezuka J, Nakamura Y, Adachi Y. Prevalence of Allergic Diseases across All Ages in Japan: A Nationwide Cross-Sectional Study Employing Designated Allergic Disease Medical Hospital Network. JMA J. 2023;6(2):165-174.
Introduction: Allergic diseases affect both children and adults, but generation-specific prevalence rates are unclear.
Methods: An online questionnaire was used from December 2021 to January 2022 to survey the prevalence of allergic diseases among staff and their families of designated allergic disease medical hospitals in Japan. In this study, bronchial asthma (BA), atopic dermatitis (AD), food allergies (FAs), allergic rhinitis (AR), allergic conjunctivitis (AC), metal allergies (MAs), and drug allergies (DAs) were the allergic diseases surveyed.
Results: In total, 18,706 individuals were surveyed (median age, 36 years; quartile range, 18-50). Allergic disease was reported in 62.2% of respondents. Across all ages, prevalence rates were as follows: BA (14.7%), AD (15.6%), FAs (15.2%), AR (47.4%), AC (19.5%), MAs (1.9%), and DAs (4.6%). The prevalence of BA and AR was higher in male children, whereas that of FAs and AC was higher in adult females. The prevalence of MAs and DAs peaked during adulthood and predominated among females.
Conclusions: Our results suggest that approximately two-thirds of the Japanese population may have an allergic disease, with AR being the most prevalent.
Key words: allergy, prevalence, allergic disease medical hospital, national cross-sectional study
Allergic diseases such as bronchial asthma (BA), atopic dermatitis (AD), food allergies (FAs), allergic rhinitis (AR), and allergic conjunctivitis (AC), with symptoms that involve multiple organs including respiratory and digestive organs and the skin, have a high prevalence in both children and adults.
Due to genetic or environmental factors, allergic diseases can arise, and their prevalence varies depending on ethnicity and culture. The prevalence of allergic diseases has been reported to vary significantly between different countries (1). In recent decades, environmental changes and advancements in treatments have significantly affected the prevalence of allergic diseases. Several surveys of the prevalence of allergic diseases have been conducted in Japan; however, in most of the reports, participants were limited to only children or adults, and not all allergic diseases have been included. Moreover, few cross-national studies of allergic disease prevalence have surveyed multiple allergic diseases across all ages. Surveys on the prevalence of allergic diseases are important to assess the effects of environmental and lifestyle changes on allergic diseases over time and across generations. It is known that during childhood allergic diseases develop dynamically over time in a phenomenon called the allergic march (2).
In 2016, the Basic Act on Allergic Disease Measures was enacted in Japan, and the government promotes the use of its comprehensive allergic disease measures (3). According to this act, each prefecture has designated allergic disease medical hospitals to provide medical care for patients with severe allergic diseases, educate the community about allergic diseases, and participate in epidemiological surveys that are conducted by the Japanese government. Thus, we carried out the first nationwide cross-sectional survey to evaluate, using the designated allergic disease medical hospital network, the prevalence of allergic diseases across all ages in Japan.
In this cross-sectional study, an online questionnaire was employed, targeting staff (physicians, nurses, laboratory technicians, pharmacists, and clerical workers) and their families at allergic disease medical hospitals. From December 2021 to January 2022, this survey was announced via a leaflet or e-mail to hospital staff. Those who were willing to participate in this survey responded to an online questionnaire.
This study was conducted according to the principles laid out in the Helsinki Declaration and the ethical guidelines for medical and health research studies that involve human subjects outlined by the Ministry of Health, Labour, and Welfare of Japan. The study was approved by an ethics committee from Toyama University (ID: R2021089). All participants provided informed consent.
To administer the online questionnaire, we used the WEBCASⓇ system (WOW WORLD Inc.). The questionnaire was written in Japanese, and the participating staff answered the questions regarding their own and their family members’ history of allergic diseases. Questions included information concerning age, sex, occupation, work facility name, history of allergic diseases, and the prevalence of current symptoms of allergic diseases. Allergic diseases investigated in this survey were BA, AD, FAs, AR, AC, metal allergies (MAs), and DAs.
The respondents who answered “Yes” to the question “Have you (or your family members) ever been diagnosed by a physician for BA, AD, FAs, AR, and AC?” were defined as “diagnosed.” Those who answered “No, but I probably have the disease” were defined as “probably having the disease.” Respondents were considered to have AR if they had a history of perennial AR (pAR) or pollinosis (PO). We calculated the history rates of allergic diseases based on those diagnosed and those probably having the disease for all allergic diseases except for MAs and DAs. Concerning MAs and DAs, there were only two responses (Yes or No) to the question “Have you (or your family members) ever been diagnosed by a physician with MAs or DAs?” Those who answered “Yes” were defined as “diagnosed.”
The respondents who reported a history of BA, AD, AR, and AC were asked the following question: “Have you (or your family members) had any symptoms of the disease during the previous 12 months?” and “Have you (or your family members) been treated for the disease during the previous 12 months?” Those who answered “Yes” to at least one of these questions were defined as having “current symptoms.”
Regarding FAs, those who answered the question “Have you (or your family members) ever been diagnosed with FAs by a physician?” with either “Yes, there are foods that have been diagnosed as allergic and are still being removed” or “No, but there are foods that have been removed due to symptoms” were defined as having “current symptoms.”
There were 14 age group categories, namely, 12 categories every 5 years from 0 to 59 years, one category for respondents aged 60-69 years, and one category for respondents aged ≥70 years. Prevalence rates and the sex ratio for each disease were calculated within each of these age categories. We calculated 95% confidence intervals for a history of each disease. Prevalence rates between male and female respondents were compared using a chi-square test. A two-sided P-value of <5% was considered significant. For the statistical analysis, STATA-17 (StataCorp, Lakeway, TX, USA) software was employed.
Fifty-eight allergic disease medical hospitals cooperated in this survey (Table 1). Of the 7,078 respondents, 105 were excluded who either declined to answer certain questions or inputted errors or duplicate data; thus, 6,973 responses were included in the analysis (nurses, n = 2,620; physicians, n = 1,391; clerks, n = 1,295; medical technologists, n = 306; pharmacists, n = 263; and others, n = 1,098). The data were analyzed from 18,706 respondents, including the information they provided regarding their family members. The median age of the respondents was 36 years (quartile, 18-50; min-max: 0-102 years), comprising 8,175 males and 10,531 females. Among all respondents, 11,626 (62.2%) were determined to have some form of allergic disease according to our criteria (males, n = 4,974, 60.8%; females, n = 6,652, 63.2%).
Table 1. List of Survey Hospitals.
| Hospital | Prefecture | Participants for analysis | Hospital | Prefecture | Participants for analysis | |
|---|---|---|---|---|---|---|
| Hokkaido University Hospital | Hokkaido | 229 | Aichi Children’s Health and Medical Center | Aichi | 75 | |
| Hirosaki University Hospital | Aomori | 109 | Fujita Health University Bantane Hospital | Aichi | 926 | |
| NHO Morioka National Hospital | Iwate | 109 | Fujita Health University Hospital | Aichi | 73 | |
| Tohoku University Hospital | Miyagi | 23 | NHO Mie National Hospital | Mie | 383 | |
| Miyagi Children’s Hospital | Miyagi | 32 | Mie University Hospital | Mie | 33 | |
| Yamagata University Hospital | Yamagata | 101 | Shiga Medical Center for Children | Shiga | 122 | |
| Fukushima Medical University Hospital | Fukushima | 58 | Kansai Medical University Hospital | Osaka | 90 | |
| Dokkyo Medical University Hospital | Tochigi | 100 | Osaka Habikino Medical Center | Osaka | 424 | |
| Gunma University Hospital | Gunma | 183 | Osaka Red Cross Hospital | Osaka | 201 | |
| Saitama Medical University Hospital | Saitama | 116 | Kobe University Hospital | Hyogo | 301 | |
| Chiba University Hospital | Chiba | 495 | The Hospital of Hyogo College of Medicine | Hyogo | 35 | |
| National Center for Child Health and Development | Tokyo | 1,114 | Hyogo Prefectural Kobe Children’s Hospital | Hyogo | 39 | |
| Tokyo Medical and Dental University Medical Hospital | Tokyo | 101 | Nara Medical University Hospital | Nara | 1,280 | |
| Tokyo Metropolitan Children’s Medical Center | Tokyo | 309 | Japanese Red Cross Wakayama Medical Center | Wakayama | 290 | |
| NHO Sagamihara National Hospital | Kanagawa | 295 | Tottori University Hospital | Tottori | 252 | |
| Kanagawa Children’s Medical Center | Kanagawa | 23 | Okayama University Hospital | Okayama | 904 | |
| Niigata University Medical & Dental Hospital | Niigata | 363 | NHO Minami-Okayama Medical Center | Okayama | 453 | |
| Toyama Prefectural Central Hospital | Toyama | 88 | Hiroshima University Hospital | Hiroshima | 1,083 | |
| Toyama University Hospital | Toyama | 840 | Yamaguchi University Hospital | Yamaguchi | 455 | |
| Kanazawa University Hospital | Ishikawa | 741 | Tokushima University Hospital | Tokushima | 324 | |
| University of Fukui Hospital | Fukui | 653 | Kagawa University Hospital | Kagawa | 20 | |
| University of Yamanashi Hospital | Yamanashi | 434 | Ehime University Hospital | Ehime | 369 | |
| Shinshu University Hospital | Nagano | 205 | Kochi Medical School Hospital | Kochi | 498 | |
| Nagano Children’s Hospital | Nagano | 480 | NHO Fukuoka National Hospital | Fukuoka | 708 | |
| Gifu University Hospital | Gifu | 486 | Saga University Hospital | Saga | 83 | |
| IUHW Atami Hospital | Shizuoka | 3 | Kumamoto University Hospital | Kumamoto | 68 | |
| Juntendo University Shizuoka Hospital | Shizuoka | 841 | Oita University Hospital | Oita | 427 | |
| Shizuoka General Hospital | Shizuoka | 109 | University of Miyazaki Hospital | Miyazaki | 26 | |
| Hamamatsu Medical Center | Shizuoka | 32 | Kagoshima University Hospital | Kagoshima | 92 |
The prevalence of a history of BA was 14.7% (those diagnosed, n = 2,420; those with a probable diagnosis, n = 327) (Table 2). The prevalence of current symptoms peaked in those aged 5-9 years (8.7%), decreased in those aged 20-29 years (2.4%), increased in adults aged ≥30 years, and remained approximately 5% higher in males aged 0-4 years and 5-9 years, and in females aged 50-54 years (P < 0.05; Figure 1-a).
Table 2. Prevalence of a History of Allergic Disease at Each Age.
| Age | n | Male/female | Bronchial asthma | Atopic dermatitis | Food allergy | Allergic rhinitis | Allergic conjunctivitis | Metal allergy | Drug allergy |
|---|---|---|---|---|---|---|---|---|---|
| Total | 18,706 | 8175/10531 | 14.7% (14.2-15.2) | 15.6% (15.0-16.1) | 15.2% (14.7-15.7) | 47.4% (46.6-48.1) | 19.5% (18.9-20.1) | 1.9% (1.7-2.1) | 4.6% (4.3-4.9) |
| Age (years) | |||||||||
| 0-4 | 1,254 | 656/598 | 9.5% (7.9-11.2) | 13.5% (11.6-15.5) | 13.0% (11.2-15.0) | 7.6% (6.2-9.3) | 2.7% (1.9-3.8) | 0% | 0.6% (0.3-1.3) |
| 5-9 | 1,378 | 708/670 | 15.6% (13.7-17.6) | 19.6% (17.5-21.8) | 18.0% (16.0-20.1) | 30.6% (28.1-33.1) | 13.7% (11.9-15.6) | 0% | 1.4% (0.8-2.1) |
| 10-14 | 1,256 | 631/625 | 14.3% (12.4-16.4) | 19.7% (17.6-22.1) | 19.3% (17.2-21.6) | 49.8% (47.0-52.6) | 21.6% (19.3-24.0) | 0.2% (0-0.6) | 1.4% (0.8-2.2) |
| 15-19 | 980 | 479/501 | 18.4% (16.0-20.9) | 16.9% (14.6-19.4) | 16.9% (14.6-19.4) | 53.4% (50.2-56.5) | 21.0% (18.5-23.7) | 0.2% (0-0.7) | 3.0% (2.0-4.2) |
| 20-24 | 1,068 | 336/732 | 13.8% (11.7-16.0) | 18.4% (16.1-20.8) | 18.4% (16.2-20.9) | 55.6% (52.6-58.6) | 19.4% (17.1-21.9) | 1.0% (0.1-1.8) | 3.6% (2.5-4.9) |
| 25-29 | 1,544 | 501/1,043 | 16.7% (14.9-18.7) | 21.0% (19.0-23.1) | 19.4% (17.5-21.5) | 58.0% (55.5-60.4) | 20.5% (18.5-22.6) | 1.7% (1.1-2.5) | 4.2% (3.3-5.3) |
| 30-34 | 1,510 | 648/862 | 17.0% (15.1-18.9) | 19.5% (17.5-21.6) | 17.7% (15.9-19.8) | 54.6% (52.0-57.1) | 21.6% (19.0-23.2) | 1.7% (1.1-2.4) | 5.0% (3.9-6.2) |
| 35-39 | 1,573 | 691/882 | 18.7% (16.9-20.8) | 20.7% (18.7-22.7) | 15.8% (14.0-17.7) | 55.7% (53.2-58.2) | 25.2% (23.1-27.5) | 2.5% (1.8-3.4) | 5.0% (3.9-6.2) |
| 40-44 | 1,669 | 704/965 | 17.2 (15.4-19.1) | 19.9% (18.0-21.9) | 17.0% (15.2-18.8) | 59.3% (56.9-61.6) | 28.1% (26.0-30.3) | 4.2% (3.3-5.3) | 6.7% (5.5-8.0) |
| 45-49 | 1,736 | 752/984 | 15.9% (14.2-17.7) | 13.5% (12.0-15.2) | 13.5% (11.9-15.2) | 56.0% (53.6-58.3) | 25.9% (23.9-28.1) | 3.8% (3.0-4.8) | 7.3% (6.1-8.6) |
| 50-54 | 1,419 | 583/836 | 13.2% (11.5-15.0) | 10.9% (9.3-12.6) | 13.7% (11.9-15.6) | 52.9% (50.3-55.5) | 23.5% (21.3-25.8) | 3.2% (2.3-4.2) | 7.0% (5.8-8.5) |
| 55-59 | 1,193 | 504/689 | 12.5% (10.7-14.5) | 8.8% (7.3-10.6) | 11.4% (9.7-13.3) | 48.9% (46.0-51.7) | 21.8% (19.5-24.2) | 3.2% (2.3-4.3) | 7.0% (5.7-8.6) |
| 60-69 | 1,151 | 603/548 | 10.9% (9.1-12.8) | 6.8% (5.4-8.4) | 9.3% (7.7-11.1) | 44.3% (40.0-47.9) | 13.5% (11.5-15.6) | 2.3% (1.6-3.4) | 6.4% (5.1-8.0) |
| 70+ | 975 | 379/596 | 7.5% (5.9-9.3) | 1.4% (0.8-2.4) | 5.1% (3.8-6.7) | 38.1% (33.0-43.3) | 4.2% (3.3-5.7) | 1.0% (0.5-1.9) | 4.1% (2.9-5.5) |
| Data are presented as a percentage (total number of “diagnosed” and “ probably having diseases”) and 95% confidence interval (95% CI). | |||||||||
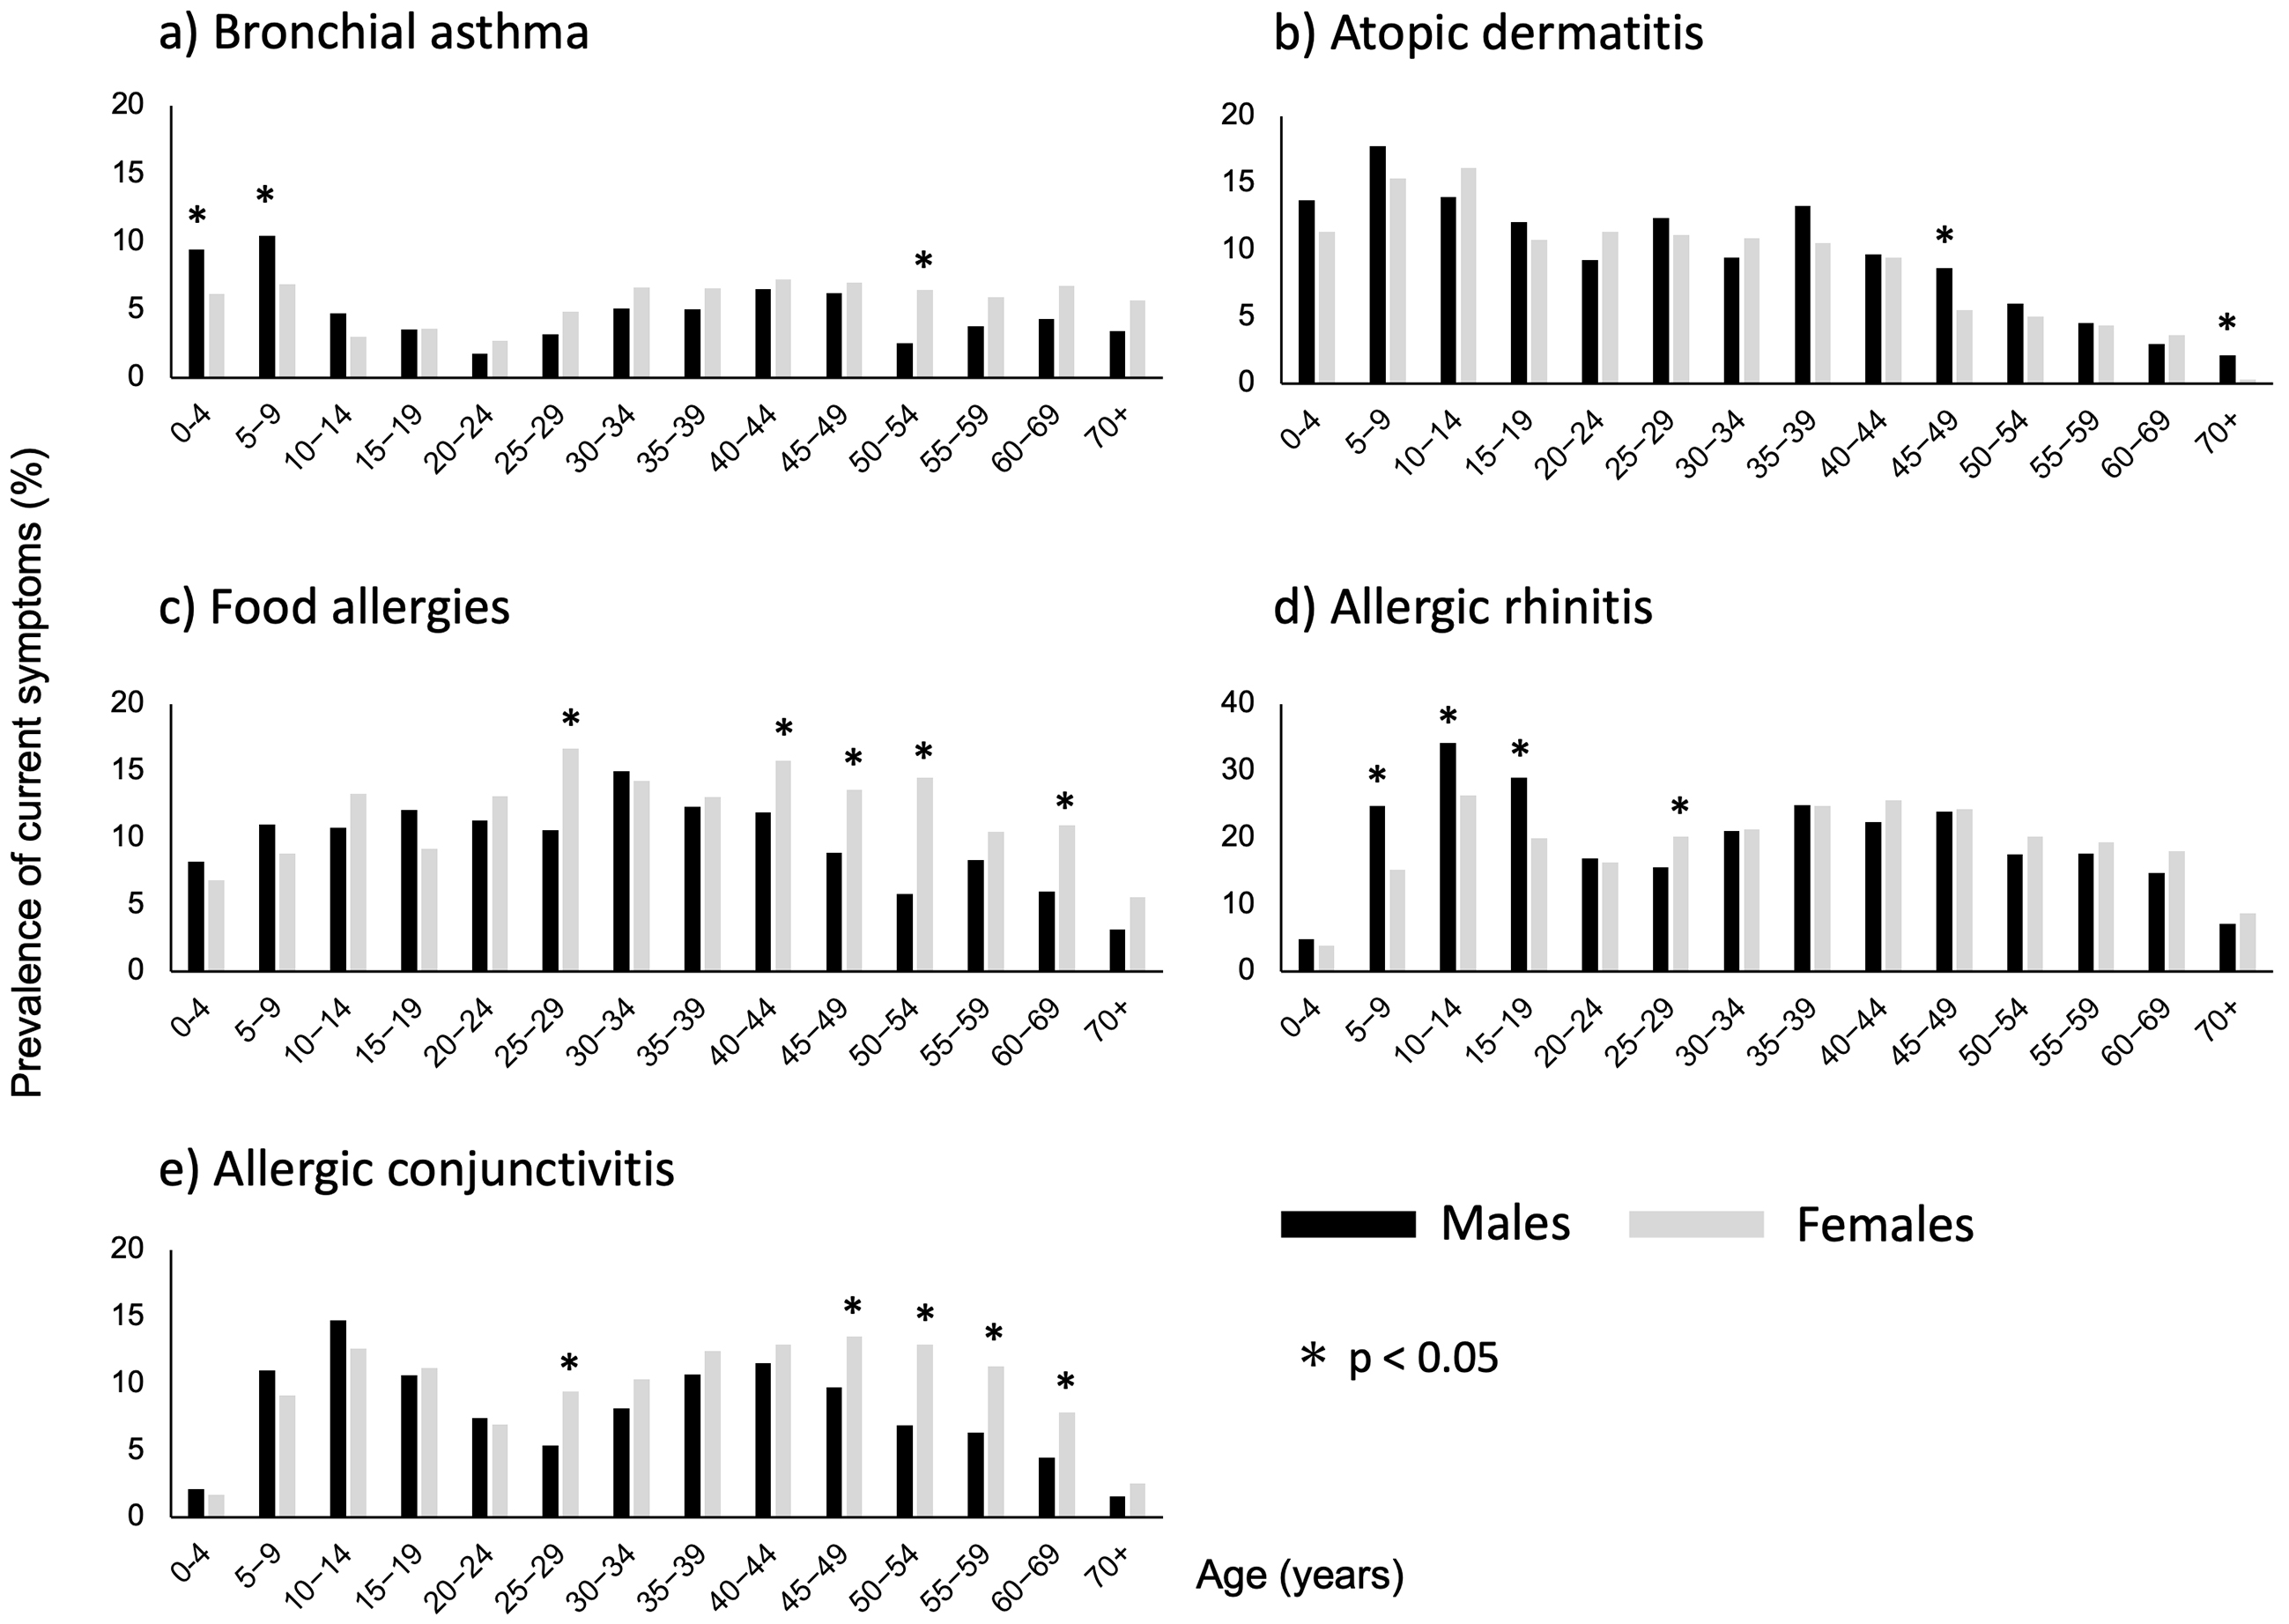
The prevalence of a history of AD was 15.6% (those diagnosed, n = 2,375; those with a probable diagnosis, n = 535; Table 2). The prevalence of current symptoms peaked in those aged 5-9 years (16.6%), decreased with age, and was higher in males aged 45-49 years and ≥70 years (P < 0.05; Figure 1-b).
The prevalence of a history of FAs was 12.3% (those diagnosed, n = 762; those with a probable diagnosis, n = 1,368) (Table 2). The prevalence of current symptoms according to age peaked in respondents aged 25-29 years (14.7%) and was higher in females aged 25-29, 40-44, 45-49, 50-54, and 60-69 years (P < 0.05; Figure 1-c).
The prevalence of a history of AR was 47.4% (Table 2). The prevalence of pAR was 27.5% (those diagnosed, n = 3,636; those with a probable diagnosis, n = 1,510). In total, 39.0% of the respondents reported a history of PO (those diagnosed, n = 5,059; probable diagnosis: n = 2,245). The prevalence of current symptoms of AR peaked in those aged 10-14 years (24.4%), decreased in those aged 20-29 years, increased in those aged ≥30 years, and was higher in males aged 5-9, 10-14, and 15-19 years, and in females aged 25-29 years (P < 0.05; Figure 1-d).
The prevalence of a history of AC was 19.5% (those diagnosed, n = 2,592; those with a probable diagnosis, n = 1,054) (Table 2). The prevalence of current symptoms according to age peaked in those aged 10-14 years (13.7%), decreased in those aged 20-29 years, increased again in respondents aged ≥30 years, and was higher in females aged 25-29, 45-49, 50-54, 55-59, and 60-69 years (P < 0.05; Figure 1-e).
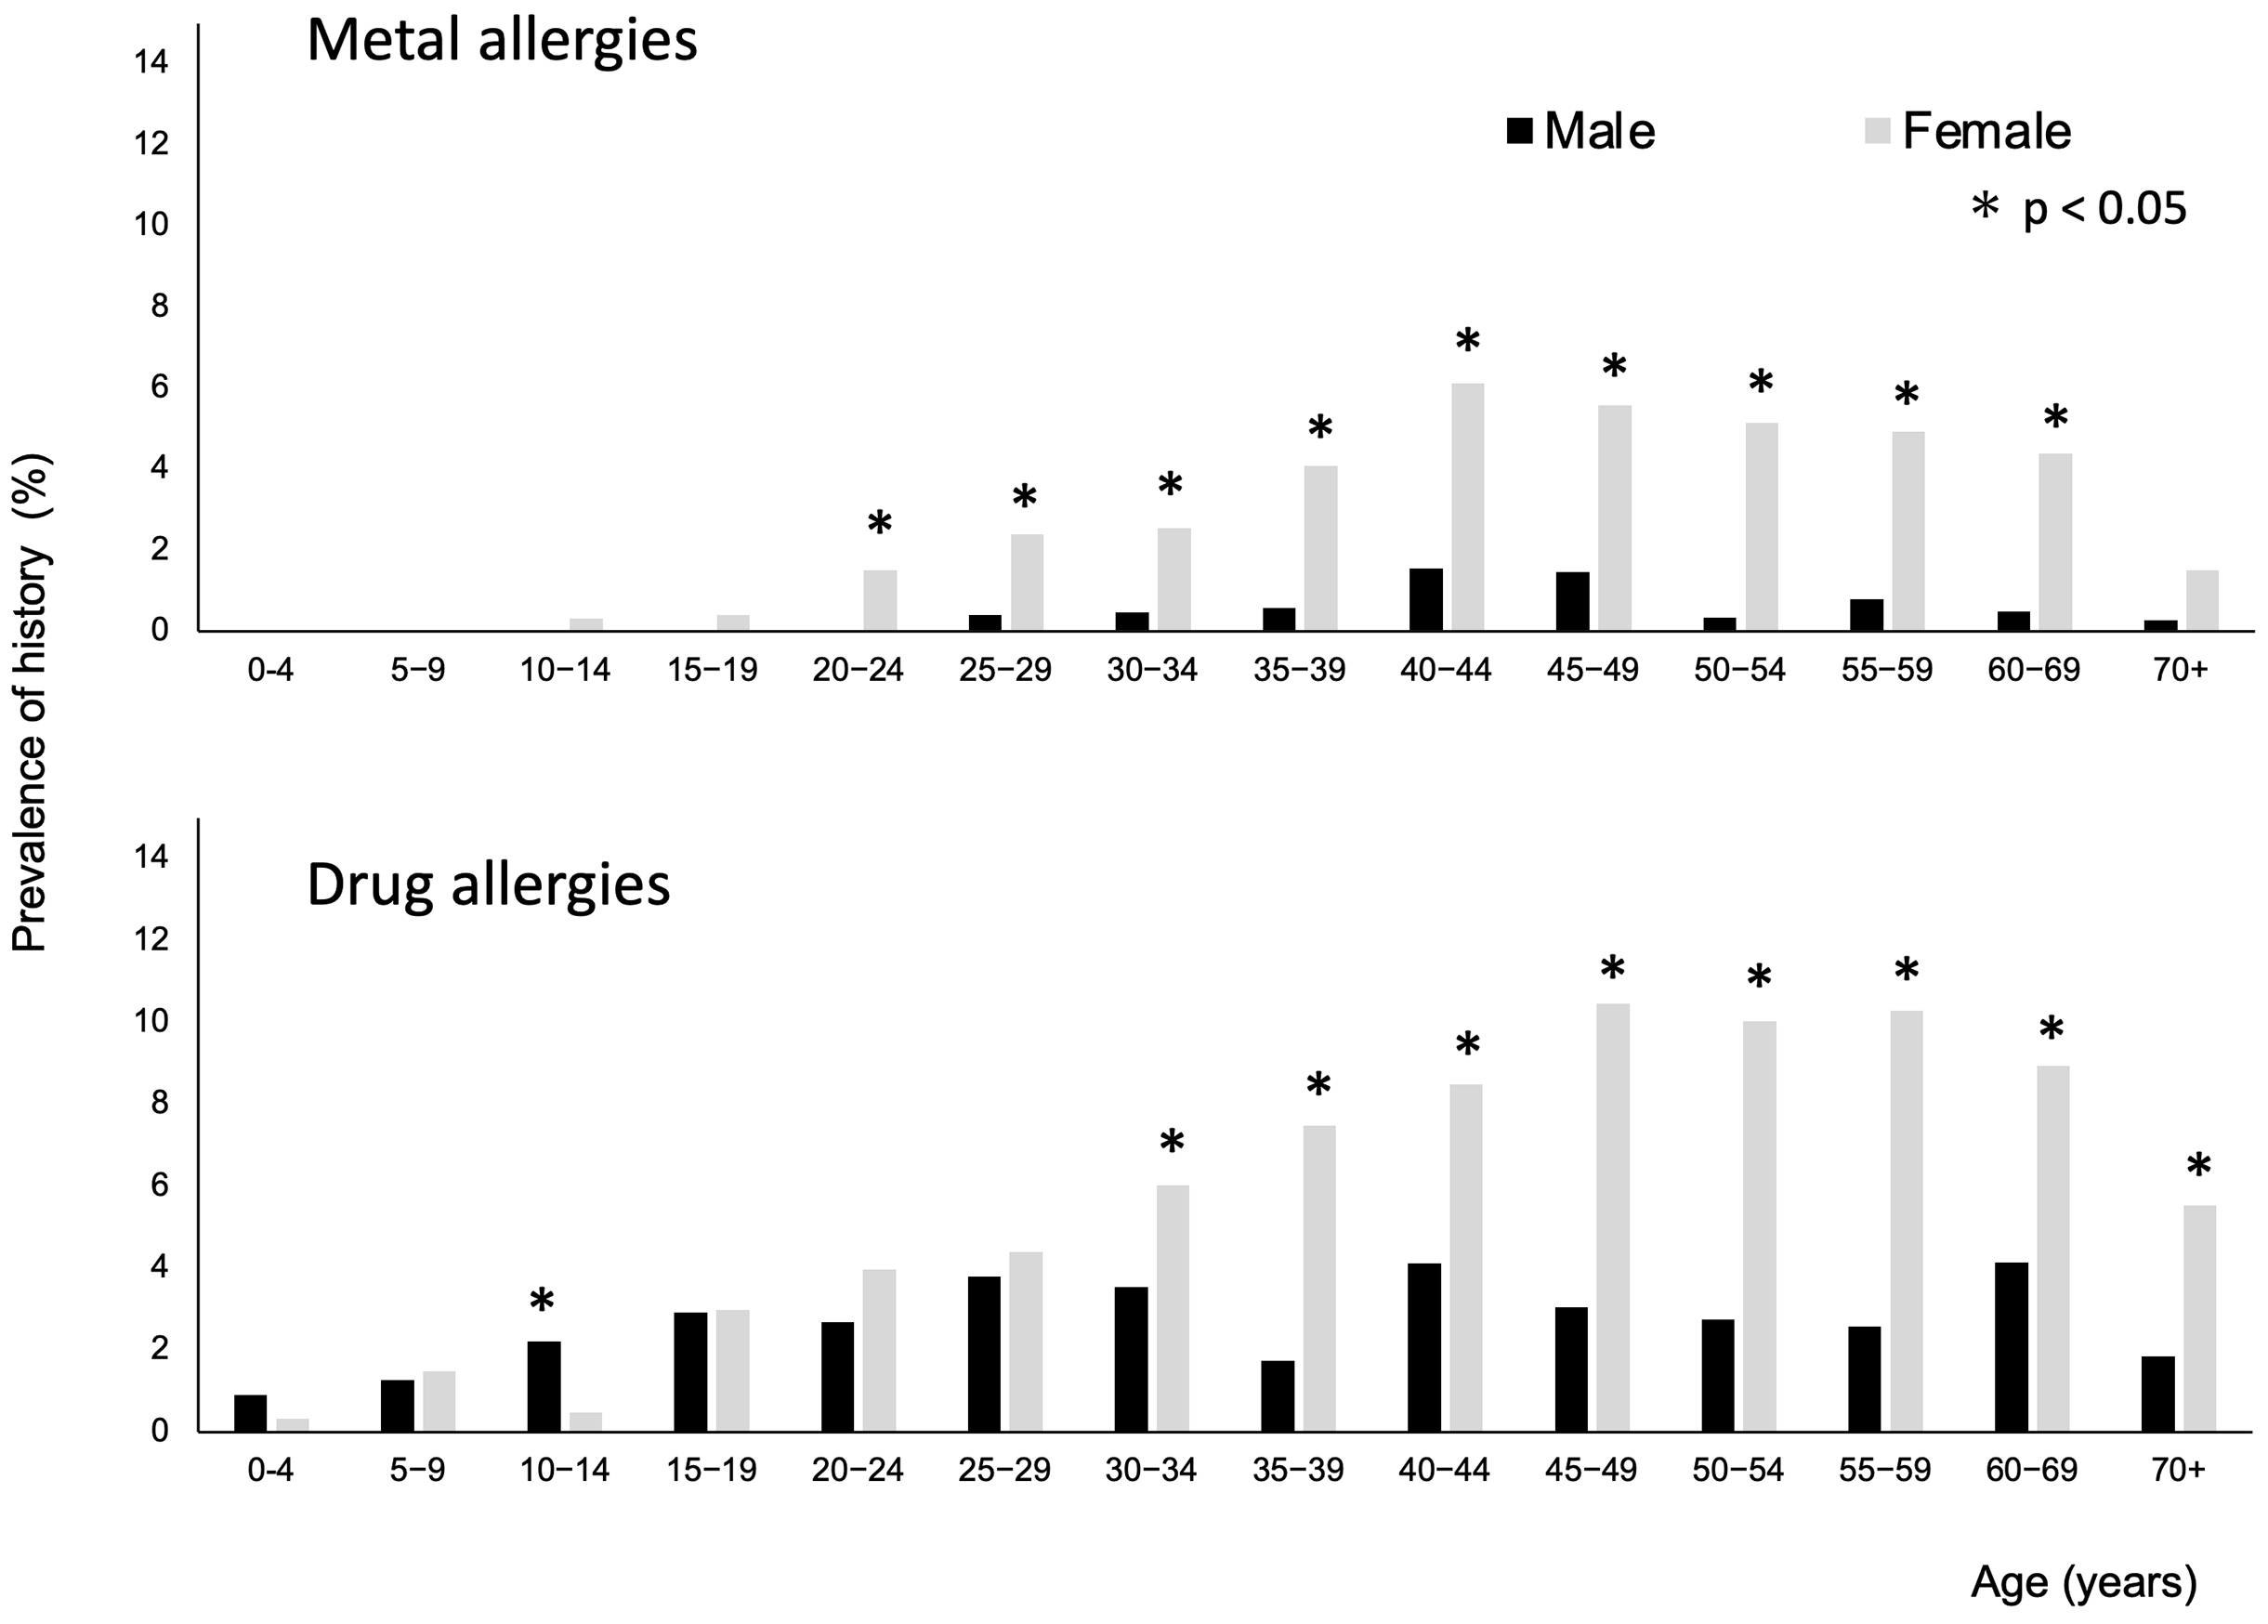
Among all participants, 363 (1.9%) and 864 (4.6%) were reported to have been diagnosed with MAs and DAs, respectively (Table 2). The mean age of the patients with MAs was 45 years (min-max:10-91). The prevalence of a history of MAs was higher in females aged 20-69 years (P < 0.05; Figure 2). The mean age of the patients with DAs was 43 (range, 1-91) years. The prevalence of a history of DAs was higher in males aged 10-14 years and in females aged ≥30 years (P < 0.05).
Among 11,626 respondents with allergic diseases, 4,326 had only one condition (37.2%), 3,312 had two (28.2%), 2,146 had three (18.4%), 1,073 had four (9.2%), 515 had five (4.4%), 221 had six (1.9%), and 33 had seven (0.3%) or more allergic diseases. Thus, 62.8% had two or more allergic diseases. Table 3 shows the overlap of allergic diseases. PO often coexisted with AC (79.9%) or pAR (69.8%). Regarding DAs, 8.9% coexisted with MAs. Conversely, for MAs, 21.2% coexisted with DAs.
Table 3. Overlap of Allergic Disease.
| Coexisted allergic diseases (numerators) | |||||||||
|---|---|---|---|---|---|---|---|---|---|
| BA | AD | FAs | pAR | PO | AC | MAs | DAs | ||
| Allergic diseases (denominator) | BA n = 2,747 |
- | 33.2% | 28.3% | 50.0% | 50.7% | 31.9% | 3.8% | 9.0% |
| AD n = 2,910 |
31.3% | - | 34.0% | 45.7% | 52.3% | 33.2% | 3.4% | 6.8% | |
| FAs n= 2,837 |
27.4% | 34.8% | - | 43.1% | 57.9% | 35.2% | 3.6% | 10.0% | |
| pAR n = 5,146 |
26.7% | 25.8% | 23.8% | - | 69.8% | 39.4% | 3.3% | 7.2% | |
| PO n = 7,304 |
19.0% | 20.8% | 22.5% | 49.1% | - | 39.8% | 2.9% | 6.7% | |
| AC n = 3 646 |
24.1% | 26.5% | 27.4% | 55.7% | 79.8% | - | 3.4% | 8.8% | |
| MAs n = 363 |
28.9% | 27.5% | 28.6% | 47.6% | 60.3% | 34.9% | - | 21.2% | |
| DAs n = 864 |
28.8% | 22.9% | 32.8% | 43.4% | 56.8% | 37.3% | 8.9% | - | |
| Data are presented as percentages of the prevalence of coexisted allergic diseases (numerators) in each disease (denominator). BA: bronchial asthma, AD: atopic dermatitis, FAs: food allergies, pAR: perennial allergic rhinitis, PO: pollinosis AC: allergic conjunctivitis, MAs: metal allergies, DAs: drug allergies |
|||||||||
Table 4 shows the prevalence of histories of allergic diseases by occupation. There was no difference in the prevalence of a history of allergic diseases between physicians, nurses, and clerks, except for MAs. The prevalence of a history of MAs tended to be higher among female clerks (10.9%).
Table 4. History of Allergic Disease by Occupations.
| 1) Male | |||||||||
|---|---|---|---|---|---|---|---|---|---|
| Occupation | n | Age mean (min-max) |
Bronchial asthma | Atopic dermatitis | Food allergy | Allergic rhinitis | Allergic conjunctivitis | Metal allergy | Drug allergy |
| Nurse | 167 | 34.1(21-60) | 16.1% (10.9-22.6) | 16.7% (11.4-23.3) | 11.3% (7.0-17.2) | 33.5% (26.4-41.2) | 20.9% (15.1-27.9) | 0% | 5.9% (2.9-10.7) |
| Physician | 932 | 43.2(24-84) | 22.5% (19.8-25.2) | 22.1% (19.5-24.9) | 12.1% (10.1-14.4) | 35.4% (32.3-38.6) | 35.4% (32.3-38.6) | 1.0% (0.4-1.8) | 5.3% (4.0-7.0) |
| Clerk | 291 | 44.6(21-69) | 17.2% (1.3-2.2) | 15.8% (11.8-20.5) | 10.6% (7.4-14.8) | 32.9% (27.6-38.7) | 26.1% (21.2-31.6) | 0.6% (0.1-2.5) | 3.4% (1.7-6.2) |
| Medical technologist | 102 | 43.3(23-72) | 18.6% (11.6-27.6) | 13.7% (7.7-22.0) | 10.7% (5.5-18.5) | 33.3% (24.3-43.4) | 21.5% (14.0-30.8) | 0% | 2.9% (0.6-8.4) |
| Pharmacist | 99 | 39.3(25-62) | 21.1% (13.6-30.6) | 24.2% (16.2-33.9) | 13.1% (7.2-21.4) | 32.3% (23.3-42.5) | 28.2% (19.7-38.2) | 1.0% (0-0.5) | 8.0% (3.6-15.3) |
| Other | 293 | 42.4(21-72) | 18.8% (14.5-23.7) | 18.7%(14.2-23.4) | 13.6% (9.9-18.1) | 37.5% (32.0-43.4) | 26.5% (21.6-32.1) | 1.3% (0.4-3.5) | 7.1% (4.5-10.7) |
| 2) Female | |||||||||
| Occupation | n | Age mean (min-max) |
Bronchial Asthma | Atopic Dermatitis | Food allergy | Allergic rhinitis | Allergic conjunctivitis | Metal allergy | Drug allergy |
| Nurse | 2453 | 37.6 (20-67) | 17.7% (16.2-19.3) | 20.0% (18.4-21.6) | 14.9% (13.5-16.4) | 36.8% (34.9-38.8) | 28.5% (26.8-30.4) | 3.9% (3.2-4.8) | 9.9% (8.8-11.2) |
| Physician | 459 | 38.2 (24-70) | 18.0% (14.5-21.7) | 20.2% (16.7-24.2) | 14.5% (11.3-17.9) | 32.0% (27.8-36.5) | 35.5% (31.1-40.1) | 3.7% (2.2-5.9) | 8.9% (6.5-11.9) |
| Clerk | 1004 | 44.5 (21-67) | 19.5% (17.1-22.1) | 21.0% (18.5-23.7) | 17.3% (14.9-19.7) | 36.9% (33.9-39.9) | 36.0% (33.0-39.0) | 7.3% (5.7-9.1) | 9.6% (7.8-11.6) |
| Medical technologist | 204 | 40.2 (22-67) | 19.1% (14.0-25.2) | 18.6% (13.5-24.7) | 15.6% (11.0-21.4) | 31.3% (25.1-38.2) | 34.3% (27.8-41.3) | 4.9% (2.4-8.8) | 6.3% (3.4-10.7) |
| Pharmacist | 164 | 36.0 (24-64) | 15.8% (10.6-22.4) | 18.2% (12.7-25.1) | 14.6% (9.6-21.0) | 35.3% (28.1-43.2) | 33.5% (26.4-41.3) | 1.8% (0.4-5.3) | 6.7% (3.4-11.7) |
| Other | 805 | 43.0 (17-80) | 18.7% (16.0-21.5) | 21.3% (18.5-24.2) | 17.7% (15.1-20.5) | 37.7% (34.3-41.1) | 37.8% (34.4-41.2) | 4.9% (0.5-6.6) | 10.9% (8.9-13.3) |
| Data are presented as a percentage (total number of “diagnosed” and “ probably having diseases”) and 95% confidence interval (95% CI). | |||||||||
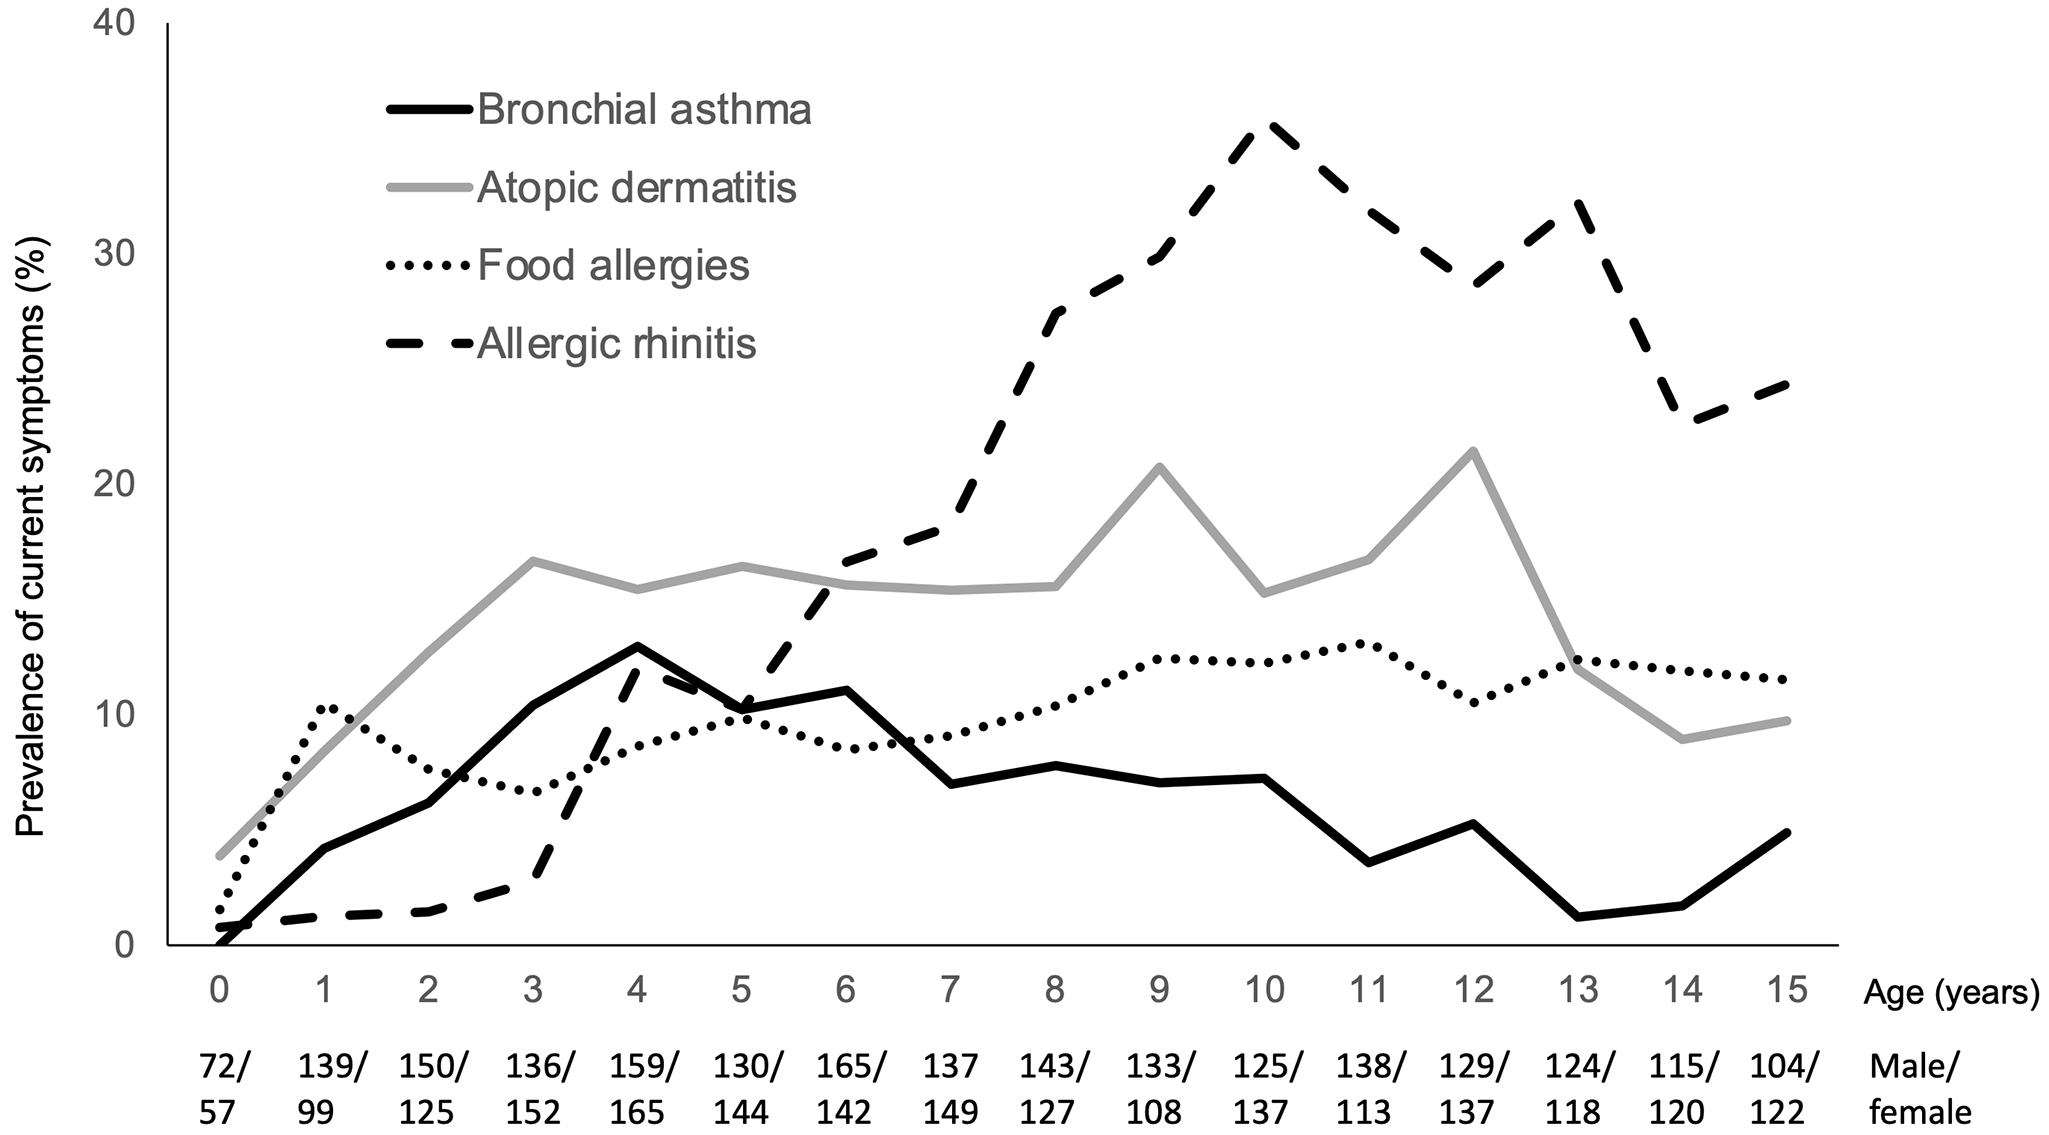
Figure 3 shows the prevalence of the current symptoms of BA, AD, FAs, and AR among children aged 0-15 years. AD is the most prevalent allergic disease at the age of 0 years, increasing to 15% at approximately 3 years of age. The prevalence of current symptoms of FAs was 10% at 1 year of age and remained at approximately 10% thereafter. The prevalence of current symptoms of BA increased until 4 years of age (12.7%) but decreased in older children. The prevalence of current symptoms of AR increased starting at 3 years of age. AR was the most prevalent allergic disease in children aged ≥6 years.
Using a designated allergic disease medical hospital network, we conducted a nationwide cross-sectional survey of allergic diseases across all ages to determine the prevalence of allergic diseases, including age-related changes and sex-related differences. These results suggest that approximately two-thirds of the Japanese population is likely to have allergic diseases.
The prevalence of current symptoms of each allergic disease varies with age. BA, AR, and AC peaked in childhood, declined among those aged 20-29 years, and then increased thereafter. AD peaked during childhood and gradually declined thereafter. The age distribution of MAs and DAs prevalence differed from that of other allergic diseases, peaking in adulthood.
When conducting a large scale survey, the method through which the presence of a disease is determined must be defined. Because allergic diseases are common and generally not severe, several patients do not visit a physician for diagnosis or treatment. Thus, this study included respondents who answered “Not diagnosed, but I (or my family members) probably have allergic diseases” to the question “Have you (or a family member) ever been diagnosed by a physician for an allergic disease?” as having an allergic disease, except for MAs and DAs. MAs and DAs were identified only when diagnosed by a physician to ensure accurate diagnosis when investigating their prevalence. Although 80% of respondents with BA or AD had been diagnosed by a physician, only 35.8% of children (aged 0-19 years) and only 28.7% of adults with FAs had been diagnosed by physicians (data not shown). This finding suggests that FA care is inadequate.
The prevalence of allergic diseases varies widely from country to country (4). Hence, the results of this survey should be compared with those of previous reports of allergy prevalence in Japan.
Most of the previous studies on the prevalence of BA in Japan have employed the ISAAC (International Study of Asthma and Allergies in Childhood) and ECRHS (European Community Respiratory Health Survey) questionnaires. The ISAAC questionnaire asks whether a respondent has experienced wheezing (whistling) (1). In 2015, a nationwide survey using the ISAAC questionnaire reported that the prevalence of wheezing was 10.2% in individuals aged 6-8 years (n = 42,176) and 8.2% in individuals who were 13-15 years (n = 36,243), which was similar to our data (5). The ECRHS Questionnaire is an international BA survey questionnaire used for individuals aged 20-44 years. In this questionnaire, a positive answer to “Have you had wheezing or whistling in your chest at any time in the last 12 months?” was employed to identify the presence of current symptoms (6). One survey that used ECRHS reported that the prevalence of current symptoms of BA in Japanese adults was 9%-10% in 2006-2007 (7).
Based on physicians’ examinations, the prevalence of AD in Japanese children was surveyed in 2000-2002 and was found to be 9.8% at 1.5 years of age, 13.2% at 3 years of age, 11.8% at 7 years of age, 10.6% at 12 years of age, and 8.2% in first-year university students (8). A similar study among adult university employees from 2006 to 2008 determined an AD prevalence of 10.2% in individuals aged 20-29 years, 8.3% in individuals aged 30-39 years, 4.1% in those aged 40-49 years, and 2.5% in those aged 50-69 years (9). The results of these studies are generally consistent with those of our study.
The prevalence of FAs varies widely between reports due to differences in disease definition and population samples. The prevalence of caregiver-reported FAs in a Japanese cohort study was 7.6%, 6.7%, and 4.9% among those aged 1, 2, and 3 years, respectively (10). Our study asked questions concerning the diagnosis and symptoms of FAs, including oral symptoms. The prevalence of FAs was found to be approximately 10% in those aged 1-19 years and 15% in those aged 20-50 years, which was higher than that in other reports, suggesting that the criteria used in this study to identify patients with FAs could have also identified patients with pollen-food allergy syndrome (11).
In 2019, a study surveyed the prevalence of AR among otolaryngologists and their family members in Japan (12). Diagnosis by an otolaryngologist is likely to involve a high degree of accuracy in terms of disease identification. The prevalence of pAR and PO across all ages was 24.5% and 42.5%, respectively (n = 19,859), which is similar to the results of our study.
Studies on the prevalence of MAs are rare. A survey of patients who visited a dermatologist revealed that contact dermatitis made up 3.92% of all skin diseases (13). There are few reports of prevalence studies on DAs, but systematic reviews of global data on DAs based on self-reports have been undertaken (14). An analysis of 53 publications, including 126,306 patients, showed that the prevalence of DAs was 8.3% (range 0.7%-38.5%) in 2016. DAs were the most prevalent in adult women, which is consistent with the results of our study. Our study is the first to survey the prevalence of MAs and DAs on a large scale in Japan.
Moreover, our study revealed variations in the prevalence of each surveyed allergic disease across all ages by sex. The prevalence of current symptoms of BA and AR was higher in male children, whereas that of FAs and AC was higher in adult females. Nevertheless, no sex-related differences in AD were observed during childhood. The prevalence of allergic diseases has previously been reported to be higher in males during childhood and to predominate among females thereafter (15), (16).
This survey showed that allergic diseases coexisted, and the overlapping rates varied depending on the disease. This may be related to differences in sensitized allergens, such as pollen and mites, in the development of each disease. The complication rate of DAs and MAs is also indicated in this study; however, it has rarely been reported in the previous literature. Hence, further analysis of the association of allergic diseases is required.
Although the survey methods and disease definitions differed between our study and previous studies, similar patterns in the prevalence of allergic diseases were observed.
Furthermore, our study revealed differences in the prevalence of allergic diseases during childhood. AD had the highest prevalence during infancy, followed by FAs and BA. These data seem to support a time course concerning allergic diseases in childhood, known as the allergic march (2). By contrast, AR is the most prevalent allergic disease in children aged >6 years. Yamamoto-Hanada et al. reported comparable results in their birth cohort study (9).
This national cross-sectional survey had several limitations. One limitation concerns selection bias because the respondents were employees of medical institutions who were likely to have been more familiar with allergic diseases than the general population. Allergic diseases are known to develop in association with occupation. Healthcare workers may be exposed to cleaning agents, disinfectants, latex, and various medications (17), but the results showed that there was no difference in the prevalence of a history of allergic diseases between physicians, nurses, and clerks, except for MAs (Table 4).
Second, participation in the survey was voluntary. Since the announcement methods used in each hospital vary, calculating an accurate response rate is challenging. Staff who had allergic symptoms or whose family members had allergic diseases might have responded to online questionnaires more often. Despite these limitations, our data showed a similar prevalence of each disease as previously reported. Recently, along with societal changes, conducting a nationwide survey has become difficult. The methods employed in our study may be useful for follow-up studies on the prevalence of allergic diseases.
In conclusion, approximately two-thirds of the Japanese population may have at least one allergic disease. Since the development of allergic diseases is related to genetic predisposition, environmental factors, culture, social background, and available treatment options, the prevalence of allergic diseases tends to change dynamically. Therefore, future epidemiological studies of allergic diseases should be conducted periodically.
None
This work was supported by a science research grant for research on allergic diseases and immunology from the Ministry of Health, Labour, and Welfare in Japan (grant number: 20FE2001).
We would like to thank the staff of the allergic disease medical hospitals and their families for their participation in this study.
YI, TK, and YA wrote the manuscript. YI, TK, and KT collected the data, performed statistical analyses, and interpreted the results. All authors designed the study and read and approved the final manuscript.
This study was approved by the ethics committee of Toyama University (ID: R2021089).
Asher MI, Montefort S, Björkstén B, et al. Worldwide time trends in the prevalence of symptoms of asthma, allergic rhinoconjunctivitis, and eczema in childhood: ISAAC Phases One and Three repeat multicountry cross-sectional surveys. Lancet. 2006;368(9537):733-43.
Hill DA, Spergel JM. The atopic march: critical evidence and clinical relevance. Ann Allergy Asthma Immunol. 2018;120(2):131-7.
Ministry of Health, Labour and Welfare, Japan. The basic act on allergic disease measures. [Internet]. 2014 [cited 2022 Dec 12]. Available from: https://www.mhlw.go.jp/file/06-Seisakujouhou-10900000-Kenkoukyoku/0000175556.pdf. Japanese.
Beasley R, Clayton T, Crane J, et al. Association between paracetamol use in infancy and childhood, and risk of asthma, rhinoconjunctivitis, and eczema in children aged 6-7 years: analysis from Phase Three of the ISAAC programme. Lancet. 2008;372(9643):1039-48.
Morikawa E, Sasaki M, Yoshida K, et al. Nationwide survey of the prevalence of wheeze, rhino-conjunctivitis, and eczema among Japanese children in 2015. Allergol Int. 2020;69(1):98-103.
Bucca C, Romano C, de Marco R, et al. Variations in the prevalence of respiratory symptoms, self-reported asthma attacks, and use of asthma medication in the European Community Respiratory Health Survey (ECRHS). Eur Respir J. 1996;9(4):687-95.
Fukutomi Y, Nakamura H, Kobayashi F, et al. Nationwide cross-sectional population-based study on the prevalences of asthma and asthma symptoms among Japanese adults. Int Arch Allergy Immunol. 2010;153(3):280-7.
Saeki H, Iizuka H, Mori Y, et al. Prevalence of AD in Japanese elementary schoolchildren. Br J Dermatol. 2005;152(1):110-4.
Saeki H, Oiso N, Honma M, et al. Prevalence of atopic dermatitis in Japanese adults and community validation of the U.K. diagnostic criteria. J Dermatol Sci. 2009;55(2):123-41.
Yamamoto-Hanada K, Pak K, Saito-Abe M, et al. Japan Environment and Children’s Study (JECS) Group. Allergy and immunology in young children of Japan: the JECS cohort. World Allergy Organ J. 2020;13(11):100479.
Sasaki M, Morikawa E, Yoshida K, et al. The prevalence of oral symptoms caused by Rosaceae fruits and soybean consumption in children; a Japanese population-based survey. Allergol Int. 2020;69(4):610-5.
Matsubara A, Sakashita M, Gotoh M, et al. Epidemiological survey of allergic rhinitis in Japan 2019. Nippon Jibiinkoka Gakkai Kaiho. 2020;123(6):485-90. Japanese.
Furue M, Yamasaki S, Jimbow K, et al. Prevalence of dermatological disorders in Japan: a nationwide, cross-sectional, seasonal, multicenter, hospital-based study. J Dermatol. 2011;38(4):310-20.
Sousa-Pinto B, Fonseca JA, Gomes ER. Frequency of self-reported drug allergy: a systematic review and meta-analysis with meta-regression. Ann Allergy Asthma Immunol. 2017;119(4):362-73.
Pinart M, Keller T, Reich A, et al. Sex-related allergic rhinitis prevalence switch from childhood to adulthood: a systematic review and meta-analysis. Int Arch Allergy Immunol. 2017;172(4):224-35.
Osman M, Hansell AL, Simpson CR, et al. Gender-specific presentations for asthma, allergic rhinitis and eczema in primary care. Prim Care Respir J. 2007;16(1):28-35.
Mazurek JM, Weissman DN. Occupational respiratory allergic diseases in healthcare workers. Curr Allergy Asthma Rep. 2016;16(11):77.
