Corresponding author: Midori Ishikawa, ishikawa.m.aa@niph.go.jp
DOI: 10.31662/jmaj.2019-0042
Received: June 25, 2019
Accepted: September 5, 2019
Advance Publication: November 8, 2019
Published: January 15, 2020
Cite this article as:
Ishikawa M, Yokoyama T, Nishi N, Miura H. Study of the Relationship between Body Mass Index, Body Image, and Lifestyle Behaviors: A Community Survey in Fiji. JMA J. 2020;3(1):41-50.
Introduction: Public health promotion efforts aimed at overweight and obesity prevention often proceed from the premise that the first step should be losing weight. Appropriate perceptions of body image may be important for improving weight loss awareness. Therefore, we aimed to examine the relationship between body mass index and body image perception in Fiji, where increasing obesity is currently the most important health-related issue.
Methods: Using the resident register based on the governmental census, one household member, aged between 18 and 69 years, was randomly selected from each household in two areas. There were 1,014 participants in the study. The questionnaire items were related to body image, dietary behaviors, physical activity, smoking habits, and alcohol consumption habits. Moreover, information regarding height, weight, blood pressure, and hemoglobin A1c were measured, and questions about social status (age, ethnicity, education, marital status, and employment), and subjective living status were asked. A multivariate logistic regression analysis was performed to analyze the relationship between body mass index (BMI) and body image perception.
Results: Data from 391 men and 537 women were analyzed. Men within higher BMI quartiles smoked less (p = 0.0004) and drank less alcohol (p = 0.042). Women in higher BMI quartiles engaged in less physical activity (p = 0.022). Among the assessed data, both men and women in the higher BMI quartiles underestimated their body image compared with their actual physique (p < 0.0001). The higher BMI was associated with underestimated body image (men: odds ratio [OR] = 3.22, 95% confidence interval [CI], 1.94–5.35; p < 0.0001; women: OR = 18.11, 95% CI, 10.10–32.47; p < 0.0001).
Conclusions: Higher BMI is strongly associated with underestimated body image among Fiji residents. Health-related counseling should be included within programs that aim to increase recognition of one’s actual physical size.
Key words: Overweight and obesity, body image, lifestyle behavior, underestimates, Fiji
Overweight and obesity represent a major public health problem and are associated with an increased risk for type 2 diabetes, cardiovascular disease, and several types of cancer (1), (2). Currently, obesity is a major public health issue in Fiji, as well as in other Pacific Island States, owing to the rapid lifestyle changes in the region, brought about by globalization and urbanization (3). An estimated 66.9% of the population is obese/overweight (4).
Public health promotion efforts aimed at weight gain and obesity prevention are often based on the assumption that raising awareness of health behaviors and weight status will motivate individuals to lose weight (4), (5), (6). However, an accurate perception of body image may be more important in successfully implementing these recommendations for controlling weight (6), (7).
Several reports indicate that obese people underestimate their own body image perception. Studies conducted in the US have observed that a high proportion of individuals who perceived themselves to be of normal weight were actually overweight or obese (8), (9), (10). In a US nationally representative study, 13% and 48.1% of obese and overweight men, respectively and 5.1% and 23.4% of obese and overweight women, respectively, believed they were “the right weight” (11).
Health guidance and education for obesity prevention and control emphasize weight monitoring with behavior changes related to diet and physical activity habits and provide instructions, such as on smoking and drinking habits. Moreover, adding guidance on body image perception may be important (12).
However, the guidelines on obesity prevention and control established by Fiji’s Ministry of Health and Medical Service (MOHMS) do not include the consistently required measures for those who underestimate their body image (13). Furthermore, a few reports state that an underestimation of body image compared with people’s true physique is important, including the relation between diet and physical activity. Therefore, we aimed to examine the relationship between obesity, body image perception, and lifestyle behaviors such as diet and physical activity.
All households in the target village were visited based on the resident register obtained from the governmental census, and the members of each family in Baulevu (rural area) and Nuffield (urban area), in the central division of Fiji, were checked. Next, a list of residents list aged between 18 and 69 years was created. Among the 1,927 households initially elected, 100 households were found to live away from the survey area, and another fifty-five households either did not have a member in the age range of 18–69 years or could provide a correct list of ages of the household members. Afterwards, one household member was randomly selected from each household to be surveyed. The number of men and women selected was the same by age group.
Invitation letters were distributed to the sampled household members. The survey was conducted in February, March, and May 2016, for those who agreed with the study’s objective. The survey took place at a designated area in the vicinity of their homes. Thus, one member from each of the 1,014 households among the 1,772 households participating in the study (participation rate: 57.2%) was invited. Data obtained from 391 men and 537 women were analyzed after excluding pregnant women and respondents who did not answer necessary items (Supplement).
The questionnaire items included indicators of existing policy measures and MOHMS guidelines in Fiji. Reports from the World Health Organization (WHO) and previous studies related to education for weight control were used (13), (14), (15), (16).
Body image perception (underestimate, appropriate. or overestimate) was described using SHOWCARD and the body mass index (BMI) (17), (18). Anthropometric measurements, comprising height and weight, were performed on all participants by health staff trained in the use of the stadiometer (Seca 213 Lightweight & Portable Stadiometer, Seca Deutschland, Germany), weight scale (Seca Clara 803 for normal weight, Seca 877 for larger weight, Seca Deutschland, Germany), and measuring tape. The anthropometric measurement procedures followed the WHO STEP guidelines (15).
Blood pressure was measured three times within three-minute intervals using a blood pressure monitor (Mediscope CONTEC08D, Mediscope International Limited, New Zealand). The average of the second and third measurements was used for the analysis. In addition, each participant was asked to provide venous blood, and 2 ml blood was taken from the forearm by a certified phlebotomist for testing HbA1c. HbA1C (g/dL) was measured using the latex particle. All samples were tested at Vanua Levu Medical Diagnostics Ltd. This sample was extracted by trained laboratory technicians. Laboratory technicians were responsible for the handling, storage, and delivery of the blood samples, with strict adherence to proper procedures to avoid contamination, as stipulated in the laboratory protocol.
The diagnostic criteria for diabetes and hypertension used the MOHMS in Fiji guidelines (13). Diabetes mellitus (DM) was defined as HbA1c ≥ 6.5% or controlled by medication, and hypertension (elevated blood pressure) was defined as blood pressure ≥140/90 mmHg or controlled by medication. In this study, the HbA1c level was divided into three categories: <5.6%, 5.6–6.5%, and >6.5%. In addition, the blood pressure level was divided into three categories: “Hypertension” was ≥140/90 mmHg or controlled by medication, “pre-hypertension” was systolic blood pressure (SBP)120–140 mmHg or diastolic blood pressure (DBP) 80–90 mmHg), and “normal” was SBP < 120 mmHg and DBP < 80 mmHg.
Social and health demographics accounted for within the sample were as follows: age; ethnicity (iTaukei, Fijian of Indian descent, other descent); education (primary school completed or less, secondary school completed, college/university completed or higher); marital status (never married, currently married, other); main work in the past 12 months (housewife, office worker, professional, service industry, student, farmer/fisherman/forester); and subjective living status (wealthy, very comfortable, reasonably comfortable, just getting along or less).
In lifestyle behaviors, at the stage of dietary behaviors, respondents were asked, “Are you going to change your dietary habits to prevent non-communicable diseases (NCDs)?” The answer was chosen from four categories: “I am not interested in change”; “I am going to change my dietary behavior in 6 months”; “I am ready to take action within the next 30 days”; “I have changed my dietary behavior relative to 6 months ago (19), (20).” At the stage of physical activity, respondents were asked, “Are you going to increase your physical activities to prevent NCDs?” The answer was chosen from four categories: “I am not interested in change”; “I am going to change my behavior in 6 months”; “I am ready to take action within the next 30 days”; “I changed my behavior more than 6 months ago (19), (20).” Moreover, smoking (currently: yes or no) and alcohol consumption in the past 12 months (daily; 5–6 days a week; 1–4 days a week; 1–3 days per month; less than once a month; never) were assessed (20).
BMI was calculated as weight (kg)/height (m)2 and categorized into quartiles (25th, 50th, 75th, and maximum percentiles). Next, characteristics and social and health status were compared by BMI quartile using the chi-square test. In addition, lifestyle behaviors (dietary habits, physical activity, smoking habits, and alcohol consumption habits) were compared by BMI quartile using the chi-square test. Furthermore, the proportion of body image perception (underestimate, appropriate, and overestimate) by BMI quartile was analyzed using the chi-square test in males and females.
After that, to analyze the clear relationship between underestimation and BMI, participants who tended to overestimate their body mass were excluded from the next analysis. Then, a multivariate logistic regression analysis was performed. In BMI quartile, the first, second, third, and fourth BMI (i.e., the dependent variable) quartiles were assigned values of Q1 and Q2 = 1 and Q3 and Q4 = 0. The higher BMI category (Q3 and Q4) was the dependent variable. Model 1 was adjusted for age, ethnicity, education, marital status, and work; and Model 2 was adjusted for age, ethnicity, education, marital status, work, subjective living status, categories of HbA1c levels, and categories of blood pressure levels.
Statistical analysis was performed using SAS software, version 9.4 (SAS Institute, Inc., Cary, NC, USA). A p-value < 0.05 was considered statistically significant.
The survey was conducted by Fiji’s MOHMS, and written consent was obtained from all participants. The analysis was submitted to the National Institutes of Public Health and National Institute of Health and Nutrition, National Institutes of Biomedical Innovation, Health and Nutrition, Japan, by Fiji’s MOHMS.
All personal information was omitted from the survey data, and the database obtained from Fiji’s MOHMS contained no personal information. This study was approved by the ethics board of the National Institute of Public Health, Japan, in June 2016 (NIPH-IBRA#12117).
Table 1 shows the demographic characteristics and social and health factors: age, ethnicity, education, marital status, main work, subjective living status, and diagnosis of DM and hypertension by BMI quartile. For males, the higher BMI quartile was related to many iTaukei (p < 0.0001), married individuals (p = 0.008), and those with hypertension (p < 0.0001). For females, those in the higher BMI quartile were older (p = 0.002), iTaukei (p < 0.0001), married (p = 0.035), and had hypertension (p < 0.0001).
Table 1. Demographic Characteristics and Social and Health Status by BMI Quartile.
| Male (n = 391) | Female (n = 537) | |||||||||||||||||||
|---|---|---|---|---|---|---|---|---|---|---|---|---|---|---|---|---|---|---|---|---|
| Q1 14.5 ≤ bmi < 22.8 |
Q2 22.8 ≤ bmi < 26.2 |
Q3 26.2 ≤ bmi < 30.3 |
Q4 30.3 ≤ bmi ≤ 52.3 |
Q1 13.9 ≤ bmi < 25.6 |
Q2 25.6 ≤ bmi < 30.1 |
Q3 30.1 ≤ bmi < 33.8 |
Q4 33.8 ≤ bmi ≤ 61.1 |
|||||||||||||
| n 97 |
% | n 97 |
% | n 100 |
% | n 97 |
% | p-value | n 131 |
% | n 137 |
% | n 131 |
% | n 138 |
% | p-value | |||
| Age class | ||||||||||||||||||||
| 18–29 | 30 | 30.9 | 27 | 27.8 | 20 | 20.0 | 12 | 12.4 | 0.350 | 50 | 38.2 | 28 | 20.4 | 22 | 16.8 | 20 | 14.5 | 0.002 | ||
| 30–39 | 21 | 21.7 | 22 | 22.7 | 24 | 24.0 | 23 | 23.7 | 27 | 20.6 | 37 | 27.0 | 33 | 25.2 | 35 | 25.4 | ||||
| 40–49 | 19 | 19.6 | 19 | 19.6 | 25 | 25.0 | 26 | 26.8 | 18 | 13.7 | 24 | 17.5 | 23 | 17.6 | 29 | 21.0 | ||||
| 50–59 | 16 | 16.5 | 16 | 16.5 | 19 | 19.0 | 24 | 24.7 | 26 | 19.9 | 28 | 20.4 | 40 | 30.5 | 37 | 26.8 | ||||
| 60–69 | 11 | 11.3 | 13 | 13.4 | 12 | 12.0 | 12 | 12.4 | 10 | 7.6 | 20 | 14.6 | 13 | 9.9 | 17 | 12.3 | ||||
| Ethnicity | ||||||||||||||||||||
| iTaukei | 34 | 35.1 | 53 | 54.6 | 56 | 56.0 | 73 | 75.3 | <.0001 | 62 | 47.3 | 89 | 65.0 | 84 | 64.1 | 111 | 80.4 | <.0001 | ||
| Fijian of Indian descent | 62 | 63.9 | 40 | 41.2 | 40 | 40.0 | 20 | 20.6 | 68 | 57.9 | 47 | 34.3 | 42 | 32.1 | 22 | 15.9 | ||||
| Fijian of other descent | 1 | 1.0 | 4 | 4.1 | 4 | 4.0 | 4 | 4.1 | 1 | 0.8 | 1 | 0.7 | 5 | 3.8 | 5 | 3.6 | ||||
| Education | ||||||||||||||||||||
| Primary school completed or less | 53 | 54.6 | 43 | 44.33 | 35 | 35.0 | 39 | 40.2 | 0.091 | 58 | 44.3 | 57 | 41.6 | 64 | 48.9 | 59 | 42.8 | 0.893 | ||
| Secondary school completed | 33 | 34.0 | 36 | 37.1 | 40 | 40.0 | 35 | 36.1 | 53 | 40.5 | 59 | 43.1 | 52 | 39.7 | 57 | 41.3 | ||||
| College/University completed or higher | 11 | 11.3 | 18 | 18.6 | 25 | 25.0 | 23 | 23.7 | 20 | 15.3 | 21 | 15.3 | 15 | 11.5 | 22 | 15.9 | ||||
| Marital status | ||||||||||||||||||||
| Never married | 37 | 38.1 | 21 | 21.7 | 21 | 21.0 | 15 | 15.5 | 0.008 | 27 | 20.6 | 11 | 8.0 | 12 | 9.2 | 15 | 10.9 | 0.035 | ||
| Currently married | 57 | 58.8 | 70 | 72.2 | 70 | 70.0 | 73 | 75.3 | 89 | 67.9 | 106 | 77.4 | 96 | 73.3 | 100 | 72.5 | ||||
| Others | 3 | 3.1 | 6 | 6.2 | 6 | 9.0 | 9 | 9.3 | 15 | 11.5 | 20 | 14.1 | 23 | 17.6 | 23 | 16.7 | ||||
| Main work in the past 12 months | ||||||||||||||||||||
| Farmer | 31 | 32.0 | 27 | 27.8 | 15 | 15.0 | 16 | 16.5 | 0.114 | 1 | 0.8 | 0 | 0.0 | 2 | 1.5 | 0 | 0.0 | <.0001 | ||
| Fisher | 0 | 0.0 | 2 | 2.1 | 1 | 1.0 | 2 | 2.1 | 0 | 0.0 | 0 | 0.0 | 1 | 0.8 | 0 | 0.0 | ||||
| Forestry | 2 | 2.1 | 3 | 3.1 | 0 | 0.0 | 1 | 1.0 | 0 | 0.0 | 0 | 0.0 | 0 | 0.0 | 0 | 0.0 | ||||
| Office worker | 4 | 4.1 | 0 | 0.0 | 7 | 7.0 | 5 | 5.2 | 5 | 3.8 | 3 | 2.2 | 2 | 1.5 | 9 | 6.5 | ||||
| Professional | 8 | 8.3 | 10 | 10.3 | 12 | 12.0 | 14 | 14.4 | 2 | 1.5 | 6 | 4.4 | 4 | 3.1 | 9 | 6.5 | ||||
| Service industry | 13 | 13.4 | 12 | 12.4 | 22 | 22.0 | 17 | 17.5 | 4 | 3.1 | 5 | 3.7 | 3 | 2.3 | 6 | 4.4 | ||||
| Student | 4 | 4.1 | 7 | 7.2 | 3 | 3.0 | 1 | 1.0 | 20 | 15.3 | 2 | 1.5 | 1 | 0.8 | 4 | 2.9 | ||||
| Housewife | 0 | 0.0 | 0 | 0.0 | 0 | 0.0 | 1 | 1.0 | 81 | 61.8 | 86 | 62.8 | 92 | 70.2 | 77 | 55.8 | ||||
| Other | 26 | 26.8 | 26 | 26.8 | 33 | 33.0 | 30 | 30.9 | 9 | 6.9 | 28 | 20.4 | 19 | 14.5 | 26 | 18.8 | ||||
| No occupation | 9 | 9.3 | 10 | 10.3 | 7 | 7.0 | 10 | 10.3 | 9 | 6.9 | 7 | 5.1 | 7 | 5.3 | 7 | 5.1 | ||||
| Subjective living status | ||||||||||||||||||||
| Wealthy or Very comfortable | 16 | 16.5 | 18 | 18.6 | 25 | 25.0 | 21 | 21.7 | 0.806 | 35 | 26.7 | 31 | 22.6 | 25 | 19.1 | 28 | 20.3 | 0.624 | ||
| Reasonably comfortable | 47 | 48.5 | 49 | 50.5 | 45 | 45.0 | 48 | 49.5 | 46 | 35.1 | 60 | 43.8 | 58 | 44.3 | 56 | 40.6 | ||||
| Just getting along or less | 34 | 35.1 | 30 | 30.9 | 30 | 30.0 | 28 | 28.9 | 50 | 38.2 | 46 | 33.6 | 48 | 36.6 | 54 | 39.0 | ||||
| Nutritional status | ||||||||||||||||||||
| Categories of HbA1c level, % † | ||||||||||||||||||||
| HbA1c < 5.6 | 61 | 62.9 | 62 | 63.9 | 60 | 60.0 | 64 | 66.0 | 0.377 | 88 | 67.2 | 98 | 71.5 | 83 | 63.4 | 86 | 62.3 | 0.143 | ||
| 5.6 ≤ HBb1c < 6.5 | 26 | 26.8 | 18 | 18.6 | 19 | 19.0 | 20 | 20.6 | 24 | 18.3 | 24 | 17.5 | 22 | 16.8 | 36 | 26.1 | ||||
| 6.5 ≤ HbA1c or medication | 10 | 10.3 | 17 | 17.5 | 21 | 21.0 | 13 | 13.4 | 19 | 14.5 | 15 | 11.0 | 26 | 19.9 | 16 | 11.6 | ||||
| Categories of blood pressure level, mmHg ‡ | ||||||||||||||||||||
| Normal | 53 | 54.6 | 32 | 33.0 | 19 | 19.0 | 11 | 11.3 | <.0001 | 88 | 67.2 | 49 | 35.8 | 33 | 25.2 | 23 | 16.7 | <.0001 | ||
| Pre-hypertension | 38 | 39.2 | 55 | 56.7 | 62 | 62.0 | 60 | 61.9 | 34 | 26.0 | 69 | 50.4 | 70 | 53.4 | 65 | 47.1 | ||||
| Hypertension | 6 | 6.2 | 10 | 10.3 | 19 | 19.0 | 26 | 26.8 | 9 | 6.9 | 19 | 13.9 | 28 | 21.4 | 50 | 36.2 | ||||
| Data are expressed as number and percent (%). The p-values were calculated using chi-square test. | ||||||||||||||||||||
| † Categories of HbA1c levels: HbA1c ≥ 6.5 or controlled by medication; 6.5 > HBb1c ≥ 5.6; 5.6 > HBb1c | ||||||||||||||||||||
| ‡ Categories of blood pressure levels: Hypertension; SBP ≥ 140 and DBP ≥ 90 or controlled by medication, Pre-hypertension; 140 > SBP ≥ 120 or 90 > DBP ≥ 80, Normal; 120 > SBP and 80 > DBP | ||||||||||||||||||||
Table 2 shows lifestyle behaviors: diet, physical activity, smoking, and alcohol consumption by BMI quartile. For males, the higher BMI quartile smoked less (p = 0.0004) and had lower alcohol consumption rates (p = 0.042). For females, those within higher BMI quartiles indicated a lower frequency of physical activity (p = 0.022).
Table 2. Lifestyle Behaviors by BMI Quartile.
| Male (n = 391) | Female (n = 537) | ||||||||||||||||||
|---|---|---|---|---|---|---|---|---|---|---|---|---|---|---|---|---|---|---|---|
| Q1 14.5 ≤ bmi < 22.8 |
Q2 22.8 ≤ bmi < 26.2 |
Q3 26.2 ≤ bmi < 30.3 |
Q4 30.3 ≤ bmi ≤ 52.3 |
Q1 13.9 ≤ bmi < 25.6 |
Q2 25.6 ≤ bmi < 30.1 |
Q3 30.1 ≤ bmi < 33.8 |
Q4 33.8 ≤ bmi < 61.1 |
||||||||||||
| n 131 |
% 24.4 |
n 137 |
% 25.5 |
n 133 |
% 24.4 |
n 138 |
% 25.7 |
p-value | n 131 |
% 24.4 |
n 137 |
% 25.5 |
n 131 |
% 24.4 |
n 138 |
% 25.7 |
p-value | ||
| Dietary habit (stage) | |||||||||||||||||||
| I am not interested in change | 6 | 6.2 | 0 | 0.0 | 4 | 4.0 | 5 | 5.2 | 0.458 | 6 | 4.6 | 6 | 4.4 | 3 | 2.3 | 6 | 4.4 | 0.087 | |
| I am going to change the behavior in 6 months | 8 | 8.3 | 11 | 11.3 | 14 | 14.0 | 12 | 12.4 | 17 | 13.0 | 26 | 19.0 | 15 | 11.5 | 13 | 9.4 | |||
| I am ready to take action within the next 30 days | 58 | 59.8 | 62 | 63.9 | 62 | 62.0 | 54 | 55.7 | 74 | 56.5 | 84 | 61.3 | 85 | 64.9 | 99 | 71.7 | |||
| I have changed the behavior more than 6 months ago | 25 | 25.8 | 24 | 24.7 | 20 | 20.0 | 26 | 26.8 | 34 | 26.0 | 21 | 15.3 | 28 | 21.4 | 20 | 14.5 | |||
| Physical activity habit (stage) | |||||||||||||||||||
| I am not interested in change | 7 | 7.2 | 0 | 0.0 | 3 | 3.0 | 5 | 5.2 | 0.179 | 5 | 3.8 | 3 | 2.2 | 3 | 2.3 | 7 | 5.1 | 0.022 | |
| I am going to change the behavior in 6 months | 7 | 7.2 | 10 | 10.3 | 17 | 17.0 | 11 | 11.3 | 18 | 13.7 | 23 | 16.8 | 16 | 12.2 | 17 | 12.3 | |||
| I am ready to take action within the next 30 days | 57 | 58.8 | 61 | 62.9 | 59 | 59.0 | 58 | 59.8 | 75 | 57.3 | 89 | 65.0 | 85 | 64.9 | 103 | 74.6 | |||
| I have changed the behavior more than 6 months ago | 26 | 26.8 | 26 | 26.8 | 21 | 21.0 | 23 | 23.7 | 33 | 25.2 | 22 | 16.1 | 27 | 20.6 | 11 | 8.0 | |||
| Smoking (currently) | |||||||||||||||||||
| Yes | 55 | 56.7 | 42 | 43.3 | 39 | 39.0 | 26 | 26.8 | 0.0004 | 15 | 11.5 | 18 | 13.1 | 16 | 12.2 | 22 | 15.9 | 0.714 | |
| No | 42 | 43.3 | 55 | 56.7 | 61 | 61.0 | 71 | 73.2 | 116 | 88.6 | 119 | 86.9 | 115 | 87.8 | 116 | 84.1 | |||
| Alcohol consumption (past 12 months) | |||||||||||||||||||
| Dairy | 7 | 7.2 | 1 | 1.0 | 1 | 1.0 | 2 | 2.1 | 0.042 | 1 | 0.8 | 0 | 0.0 | 0 | 0.0 | 0 | 0.0 | 0.724 | |
| 5–6 days a week | 1 | 1.0 | 0 | 0.0 | 3 | 3.0 | 1 | 1.0 | 0 | 0.0 | 0 | 0.0 | 0 | 0.0 | 0 | 0.0 | |||
| 1–4 days a week | 9 | 9.3 | 9 | 9.3 | 14 | 14.0 | 7 | 7.2 | 2 | 1.5 | 3 | 2.2 | 2 | 1.5 | 3 | 2.2 | |||
| 1–3 days per month | 21 | 21.7 | 23 | 23.7 | 16 | 16.0 | 12 | 12.4 | 7 | 5.3 | 6 | 4.4 | 5 | 3.8 | 11 | 8.0 | |||
| Less than once a month/never | 59 | 60.8 | 64 | 66.0 | 66 | 66.0 | 75 | 77.3 | 121 | 92.4 | 128 | 93.4 | 124 | 94.7 | 124 | 81.0 | |||
| Data are expressed as number and percent (%). The p-values were calculated using chi-square test. | |||||||||||||||||||
Figure 1 shows the relationship between BMI and body image perceptions for both male and female subjects. Those who were overweight and obese (BMI) underestimated their actual body size. This result was true for both male and female subjects.
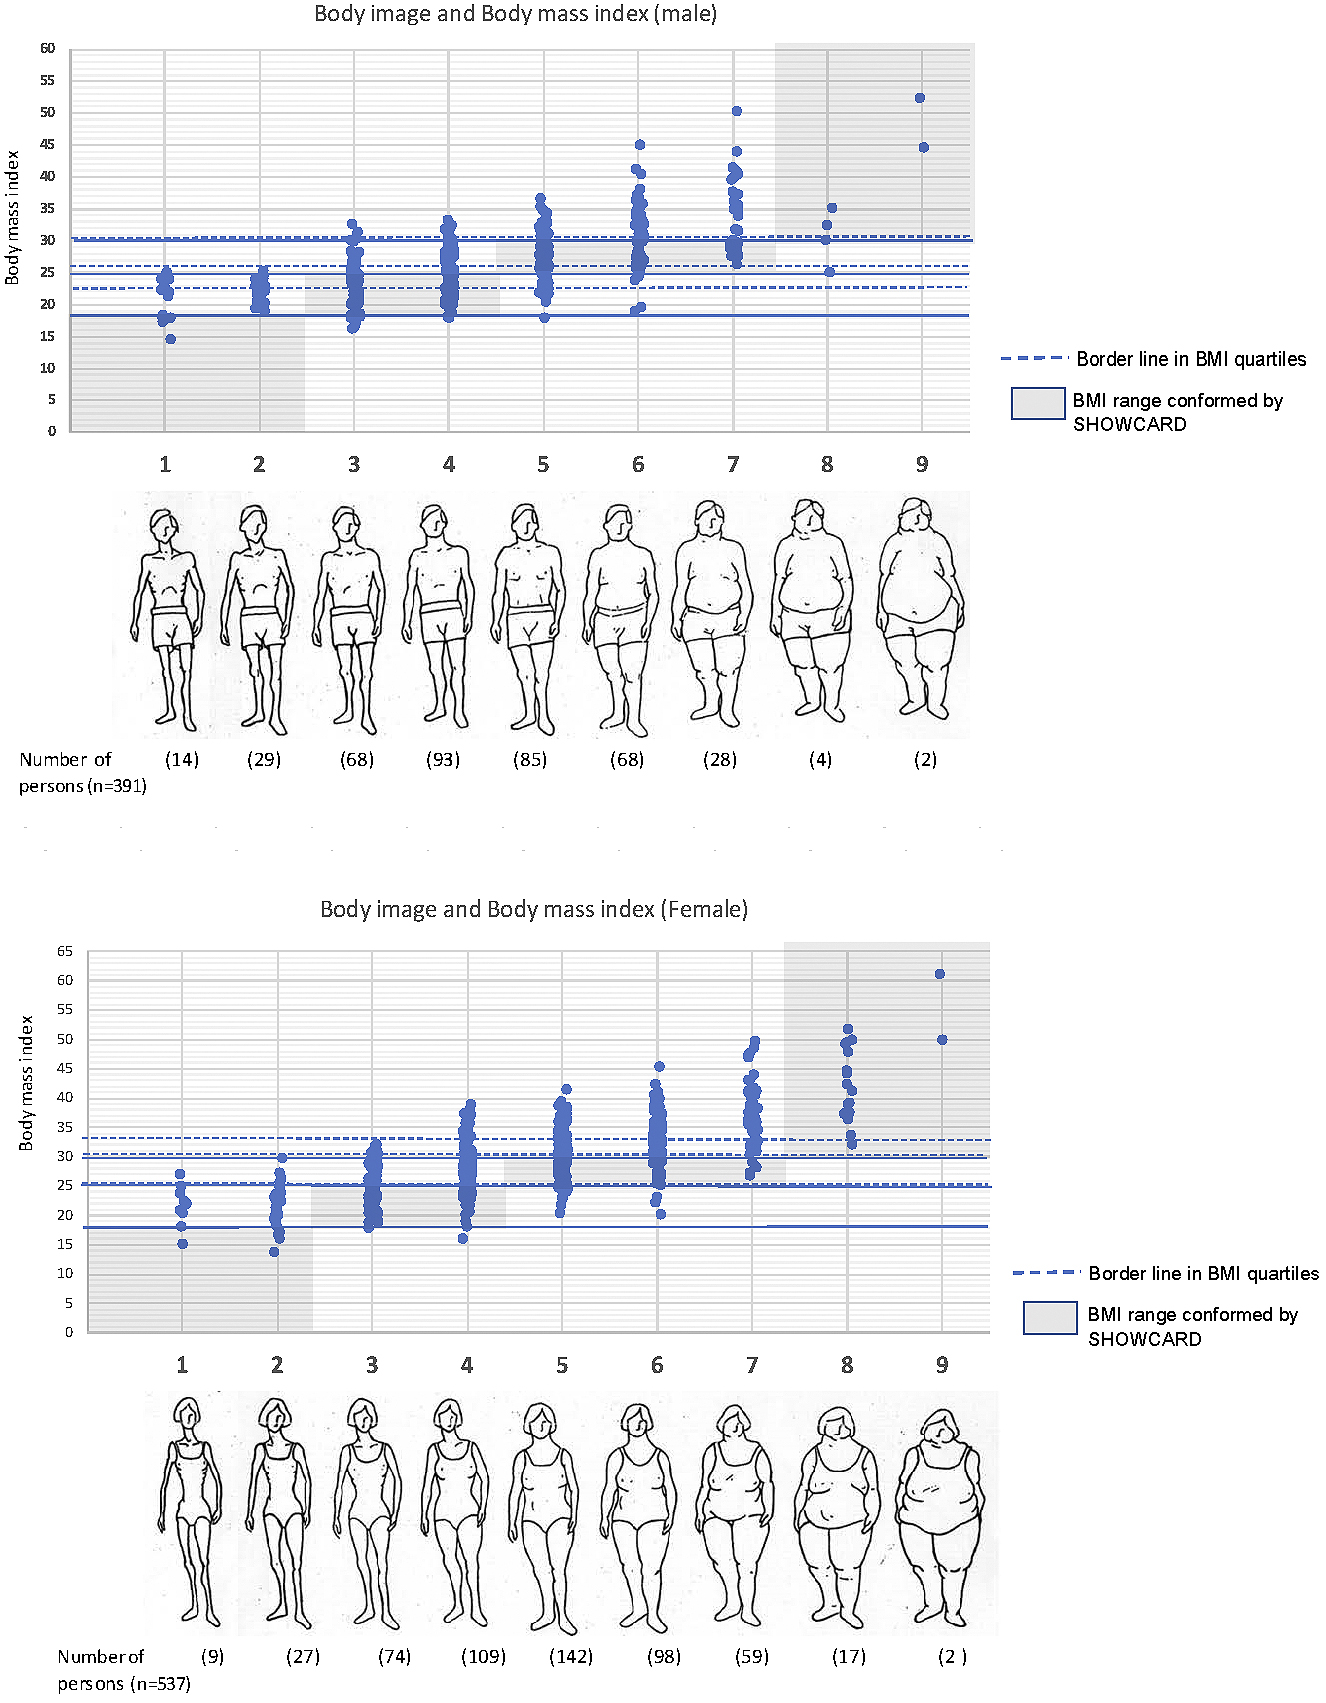
Figure 2 shows the proportion of body image perception by BMI quartile in both males and females. Whether the body image perception (underestimate, appropriate, or overestimate) was comparable with the actual physique (BMI < 18.5 = underweight, 18.5 ≤ BMI < 25.0 = normal, 25.0 ≤ BMI < 30.0 = overweight, BMI ≤ 30.0 = obesity) was confirmed. In terms of excess weight and obesity, both men and women underestimated their body image when compared with their actual BMI (p < 0.0001). Moreover, sub-analyzes indicated this phenomenon occurred more often among older obese men than young men (p = 0.011).
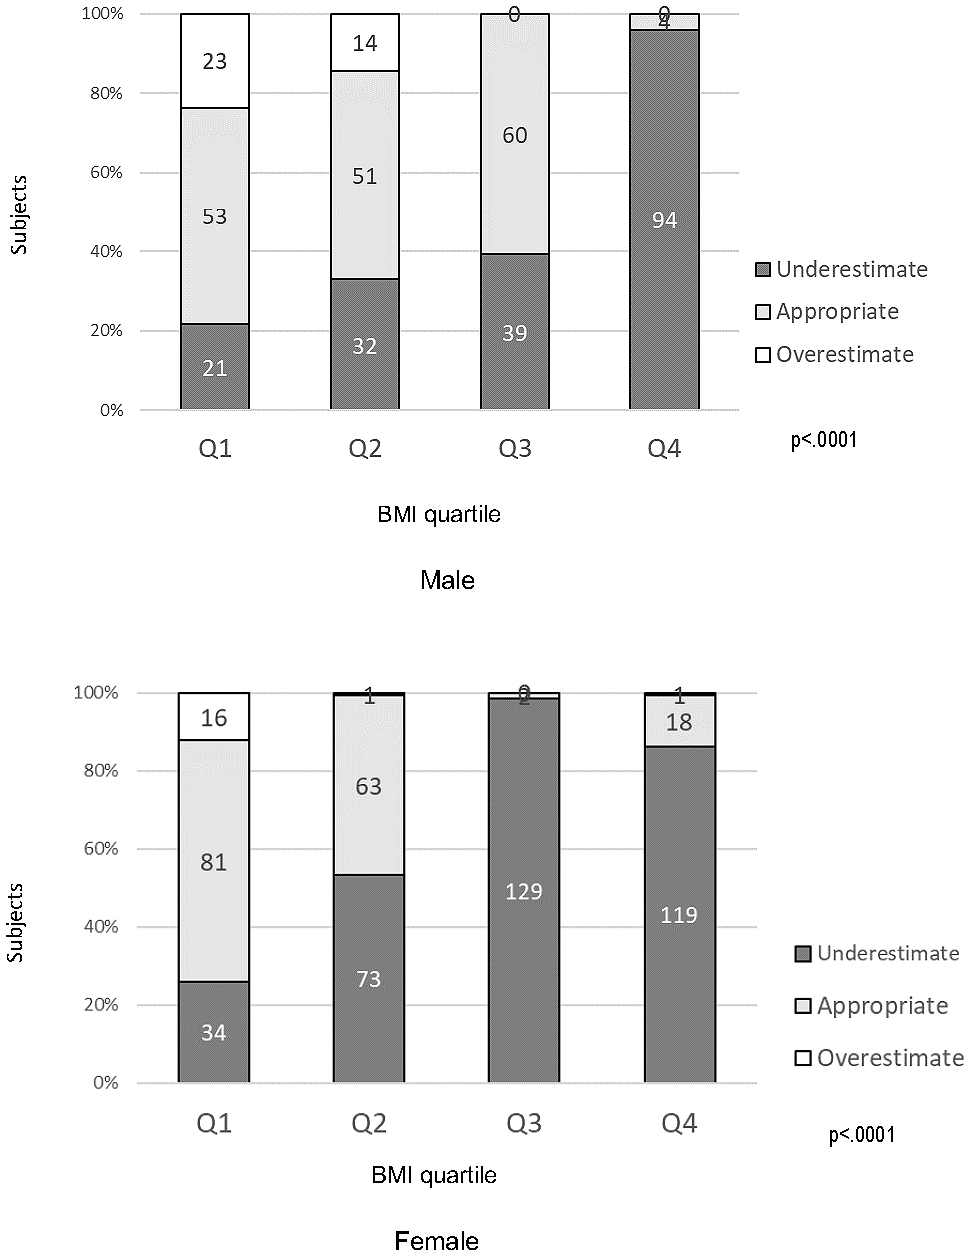
Table 3 shows the factors in higher obesity related to body image and lifestyles behaviors in male. In Model 1, these factors included an underestimation of body image (odds ratio [OR] = 3.57; 95% confidence interval [CI]: 2.20–5.81; p < 0.001) and smoking habits (OR = 1.71; 95% CI: 1.04–2.82; p = 0.036). In Model 2, these factors included an underestimation of body image (OR = 3.22; 95% CI: 1.94–5.35; p < 0.001). Then, stepwise analysis was performed, and the result was same as Model 2.
Table 3. Factors in Higher Obesity Related to Body Image and Lifestyles Behaviors (Male).
| Model 1 | Model 2 | |||||||||
|---|---|---|---|---|---|---|---|---|---|---|
| OR | 95%CI | p-value | OR | 95%CI | p-value | |||||
| Perception of body image | Appropriate (no: underestimate) |
yes | 1.00 | 1.00 | ||||||
| no | 3.57 | 2.20 | 5.81 | <.0001 | 3.22 | 1.94 | 5.35 | <.0001 | ||
| Dietary habit | Have changed behavior more than 6 months ago | yes | 1.00 | 1.00 | ||||||
| no | 1.34 | 0.76 | 2.36 | 0.306 | 1.49 | 0.82 | 2.70 | 0.192 | ||
| Physical activity | Have changed behavior more than 6 months ago | yes | 1.00 | 1.00 | ||||||
| no | 1.46 | 0.83 | 2.56 | 0.190 | 1.61 | 0.89 | 2.93 | 0.116 | ||
| Smoking | Currently smoke | yes | 1.00 | 1.00 | ||||||
| no | 1.71 | 1.04 | 2.83 | 0.036 | 1.53 | 0.90 | 2.61 | 0.120 | ||
| Alcohol consumption | Less than once a month/never past 12 months | yes | 1.00 | 1.00 | ||||||
| no | 0.89 | 0.53 | 1.50 | 0.655 | 0.81 | 0.47 | 1.39 | 0.439 | ||
| The higher BMI categories (Q3 and Q4) were the dependent variables. The factors that might affect BMI included perceptions of body image, dietary habit, physical activity, smoking habits, and alcohol consumption habits. | ||||||||||
| Model 1: adjusted for age, ethnicity, education, marital status, work | ||||||||||
| Model 2: adjusted for age, ethnicity, education, marital status, work, subjective living status, categories of HbA1c level, categories of blood pressure levels | ||||||||||
| OR: odds ratio, CI: confidence interval | ||||||||||
Table 4 shows the factors in higher obesity related to body image and lifestyle behaviors for females. In Model 1, these factors included an underestimation of body image (OR = 17.05; 95% CI: 9.78–29.71; p < 0.001). Moreover, in Model 2, these factors included an underestimation of body image (OR = 18.11; 95% CI: 10.10–32.47; p < 0.001). Then, stepwise analysis was performed, and the result was same as Model 2.
Table 4. Factors in Higher Obesity Related to Body Image and Lifestyle Behaviors (Female).
| Model 1 | Model 2 | |||||||||
|---|---|---|---|---|---|---|---|---|---|---|
| OR | 95%CI | p-value | OR | 95%CI | p-value | |||||
| Perception of body image | Appropriate (no: underestimate) |
yes | 1.00 | 1.00 | ||||||
| no | 17.05 | 9.78 | 29.71 | <.0001 | 18.11 | 10.10 | 32.47 | <.0001 | ||
| Dietary habit | Have changed behavior more than 6 months ago | yes | 1.00 | 1.00 | ||||||
| no | 1.21 | 0.75 | 1.95 | 0.435 | 1.22 | 0.74 | 2.02 | 0.431 | ||
| Physical activity | Have changed behavior more than 6 months ago | yes | 1.00 | 1.00 | ||||||
| no | 1.62 | 0.98 | 2.68 | 0.060 | 1.49 | 0.88 | 2.52 | 0.142 | ||
| Smoking | Currently smoke | yes | 1.00 | 1.00 | ||||||
| no | 1.15 | 0.66 | 2.00 | 0.628 | 1.05 | 0.58 | 1.90 | 0.864 | ||
| Alcohol consumption | Less than once a month/none past 12 months | yes | 1.00 | 1.00 | ||||||
| no | 1.46 | 0.70 | 3.06 | 0.317 | 1.60 | 0.74 | 3.50 | 0.235 | ||
| The higher BMI categories (Q3 and Q4) were the dependent variables. The factors that might affect BMI included perceptions of body image, dietary habit, physical activity, smoking habits, and alcohol consumption habits. | ||||||||||
| Model 1: adjusted for age, ethnicity, education, marital status, work | ||||||||||
| Model 2: adjusted for age, ethnicity, education, marital status, work, subjective living status, categories of HbA1c levels, categories of blood pressure levels | ||||||||||
| OR: odds ratio, CI: confidence interval | ||||||||||
The present study suggests that obesity is strongly associated with underestimated body image in Fiji. Recent research found that cultural norms, ethnicity, and socioeconomic status influence the relationship between BMI and body image perception (21), (22), (23). Moreover, changes in status related to marriage, childbirth, and parenting can change the perception of body image (24). In another study, those who were overweight not only underestimated their body image but also had low concerns about the threat of obesity (25), (26).
According to this study’s results, besides ethnicity, body image underestimation was a factor related to obesity, regardless of whether the participant was married. Furthermore, another study reported differences in body image satisfaction and eating attitudes between rural and urban young adult females (12), (27). Although this study included both urban and rural areas, body image perception and ethnicity were related with obesity regardless of the area. Education and guidance, starting from a young age and based on ethnic characteristics and body image perceptions, are needed (28), (29). In the next study, we aim to identify the appropriate body image for each BMI quartile, with regard to ethnicity, and analyze the participants’ characteristics related to the perception of body image.
In the MOHMS of Fiji, the guidelines on obesity prevention and control do not include priority measures for those who underestimate their body image (13). However, since the importance of counseling in this population has been agreed upon (14), content geared toward an accurate assessment of one’s body image should be included (30), (31).
Our study has certain limitations. First, our sample size may be relatively small compared with other similar epidemiological studies conducted in developed countries, because we started with identifying all members of a family by visiting households. Therefore, although the target number was small, it was possible to select the target person from the accurate resident list.
Second, there were more women than men in the survey collaborators. Of the participants in this study, about sixty percent of women were housewives, while forty percent of men were farmers or workers in the service industry. Women may consider it easier to participate in a survey than men. In the future, it is necessary to reconsider the survey method for men.
Third, the households that did not participate in this survey were those with no one at home at the time, and their work place (e.g., farm or company) was far from their house. Despite these limitations, higher BMI was associated with underestimation of body image.
Higher BMI is strongly associated with underestimated body image among Fiji residents. Health-related counseling should be included within programs that aim to increase the recognition of one’s actual physical size.
None
This work was supported by Grants-in-Aid for Scientific Research from the Japan Ministry of Health, Labour and Welfare (grant number H27 Global Scale/issue General 002).
The funding institution had no role in the study design, data collection, analysis and interpretation of results, or in the writing of the manuscript, or the decision to submit the paper for publication.
This study was conducted as part of the Project for Prevention and Control of Non-Communicable Diseases under the Japan International Cooperation Agency (JICA) and Fiji’s Ministry of Health and Medical Service (MOHMS). The authors thank all of the staff of JICA and Fiji’s MOHMS.
Midori Ishikawa conceptualized and analyzed the study, drafted the initial manuscript, and approved the final manuscript as submitted.
Tetsuji Yokoyama supervised the statistical analyses, reviewed and revised the manuscript, and approved the final manuscript as submitted.
Nobuo Nishi conceptualized and designed the study, coordinated the data collection, reviewed and revised the manuscript, and approved the final manuscript as submitted.
Hiroko Miura supervised this study, critically reviewed and revised the manuscript, and approved the final manuscript as submitted.
This study was approved by the ethics board of the National Institute of Public Health in Japan (NIPH-IBRA#12117).
World Bank. Non-Communicable Disease (NCD) Roadmap Report. Washington, DC: World Bank Group; 2014. 7-13 p.
Piukala S, Clark H, Tukuitonga C, et al. Turning the tide on non-communicable diseases in the Pacific region. The Lancet Glob Health. 2016;4(12):e899-900.
Gyaneshwar R, Naidu S, Raban MZ, et al. Absolute cardiovascular risk in a Fiji medical zone. BMC Public Health. 2015;16:128.
WHO/WPRO: Obesity in the Pacific: too big to ignore. Based on the outcome of the workshop on Obesity Prevention and Control Strategies in the Pacific [Internet]. Manila: World Health Organization Regional Office for the Western Pacific; 2002 [cited 2019 Sep 21]. Available from: https://www.who.int/nutrition/publications/obesity/9822039255/en/.
Mchiza ZJ, Parker W, Makoae M, et al. Body image and weight control in South Africans 15 years or older: SANHANES. BMC Public Health. 2015;15:992. doi: 10.1186/s12889-015-2324-y.
Simeon DT, Rattan RD, Panchoo K, et al. Body image of adolescents in a multi-ethnic Caribbean population. Eur J Clin Nutr. 2003;57(1):157-62.
Hoort B, Guterstam A, Ehrsson HH. Being Barbie B: The size of one’s own body determines the perceived size of the world. Plos One. 2011;6(5):e20195. doi: 10.1371/journal.pone.0020195.
Sutcliffe CG, Schultz K, Brannock JM, et al. Do people know whether they are overweight? Concordance of self-reported, interviewer-observed, and measured body size. Cancer Causes Control. 2015;26(1):91-8.
Bays HE, Bazata DD, Fox KM, et al. Perceived body image in men and women with type 2 diabetes mellitus: correlation of body mass index with the figure rating scale. Nutr J. 2009;8:57. doi: 10.1186/1475-2891-8-57.
Mikolajczyk RT, Iannotti RJ, Farhat T, et al. Ethnic differences in perceptions of body satisfaction and body appearance among U.S. schoolchildren: a cross-sectional study. BMC Public Health. 2012;12:425. doi: 10.1186/1471-2458-12-425.
Yaemsiri S, Slining MM, Agarwal SK. Perceived weight status, overweight diagnosis, and weight control among US adults: the NHANES 2003-2008 Study. Int J Obes. 2011;35:1063-70.
Prioreschi A, Wrottesley V, Cohen E, et al. Examining the relationships between body image, eating attitudes, BMI, and physical activity in rural and urban South African young adult females using structural equation modeling. PloS One. 2017;12(11):e0187508. doi: 10.1371/journal.pone.0187508.
MOHMS, Fiji: The wellness approach. 2002 [Internet]. Suva: Ministry of Health and Medical Service, Fiji [cited 2019 Jun 21]. Available from: http://www.health.gov.fj/?page_id=706#5.
JICA: The project for prevention and control of Non-Communicable diseases/2015-2020 [Internet]. Suva: Japan International Cooperation Agency [cited 2019 Jun 21]. Available from: https://www.jica.go.jp/english/news/field/2015/150729_01.html.
WHO: Part 3 Data Collection, Section 5 Collecting Step 2 data: Physical Measurements. WHO STEPS Surveillance 2017 [Internet]. Geneva: World Health Organization [cited 2019 Jun 21]. Available from: https://www.who.int/ncds/surveillance/steps/Part3_Section4.pdf.
Ahima RS, Lazar MA. The health risk of obesity—Better metrics imperative. Science. 2013;341(6148):856-8.
Stunkard AJ, Sorensen T, Schulsinger F. The genetics of neurological and psychiatric disorders. New York (NY): Raven Press; 1983. Use of the Danish Adoption Register for the study of obesity and thinness; p.115-20.
Bibiloni MM, Coll JL, Pich J, et al. Body image satisfaction and weight concerns among a Mediterranean adult population. BMC Public Health. 2017;17:39. doi: 10.1186/s12889-016-3919-7.
Norcross JC, Krebs PM, Prochaska JO. Stages of change. J Clin Psychol. 2011;67(2):143-54. doi: 10.1002/jclp.20758.
Krebs P, Norcross JC, Nicholson JM, et al. Stages of change and psychotherapy outcomes: A review and meta-analysis. J Clin Psych. 2018;74(11):1964-79. doi: 10.1002/jclp.22683.
Dinsa GD, Goryakin Y, Fumagalli E, et al. Obesity and socioeconomic status in developing countries: a systematic review. Obes Rev. 2012;13(11):1067-79.
Wardle J, Haase AM, Steptoe A. Body image and weight control in young adults: international comparisons in university students from 22 countries. Int J Obes. 2006;30(4):644-51.
Noh JW, Kwon YD, Yang Y, et al. Relationship between body image and weight status in east Asian countries: comparison between South Korea and Taiwan. BMC Public Health. 2018;18:814. doi: 10.1186/s12889-018-5738-5.
Bove CF, Sobal J. Body weight relationships in early marriage: Weight relevance, weight comparisons, and weight talk. Appetite. 2011;57(3):729-42.
Okop KJ, Mukumbang FC, Mathole T, et al. Perceptions of body size, obesity threat and the willingness to lose weight among black South African adults: a qualitative study. BMC Public Health. 2016;16:365. doi: 10.1186/s12889-016-3028-7.
Alleva JM, Sheeran P, Webb TL, et al. A meta-analytic review of stand-alone interventions to improve body image. PloS One. 2015;10(9):e0139177. doi: 10.1371/journal.pone.0139177.
Nayir T, Uskun E, Yürekli MV, et al. Does body image affect quality of life?: A population based study. PLoS One. 2016;11(9):e0163290.
Nicolaou M, Doak C, Dam R, et al. Body size preference and body weight perception among two migrant groups of non-Western origin. Public Health Nutr. 2008;11:1332-41. doi: 10.1017/S1368980008002966.
Mintem GC, Gigante DP, Horta BL. Change in body weight and body image in young adults: a longitudinal study. BMC Public Health. 2015;15:222. doi: 10.1186/s12889-015-1579-7.
Henriques A, Alves E, Barros H, et al. Women’s satisfaction with body image before pregnancy and body mass index 4 years after delivery in the mothers of generation XXI. PLoS One. 2013;8(7):e70230. doi: 10.1371/journal.pone.0070230.
Sánchez-Johnsen L, Fitzgibbon ML, Martinovich Z, et al. Ethnic differences in correlates of obesity between Latin-American and Black Women. Obes Res. 2004;12(4):652-60. doi: 10.1038/oby.2004.
