Corresponding author: Yoko Ishii, ishii.yoko@u-nagano.ac.jp
DOI: 10.31662/jmaj.2022-0171
Received: September 13, 2022
Accepted: December 13, 2022
Advance Publication: March 13, 2023
Published: April 14, 2023
Cite this article as:
Ishii H, Ishii Y. Self-rated Health and Related Factors before and during the COVID-19 Outbreak in Japan. JMA J. 2023;6(2):196-200.
Key words: self-rated health, COVID-19, subjective economic state, healthy behaviors
Self-rated health (SRH) status is correlated with objective health indicators (1). It is a good predictor of morbidity, mortality, and other health outcomes (2), (3). Moreover, it has been effectively used in studies to document social inequalities in health (4), (5). The coronavirus disease 2019 (COVID-19) outbreak measures have had a large impact on people’s lives. In Japan, the government declared a state of emergency in seven prefectures on April 07, 2020. A nationwide emergency was imposed on 16 April 2020 and ended on May 25, 2020. This study aimed to compare the factors related to SRH before and during the spread of COVID-19. To reveal how SRH changed during COVID-19 outbreak in Japan, we examined SRH change before and during the COVID-19 outbreak by a secondary analysis of the data in the “Survey of Public Awareness for Food and Nutrition Education” conducted by the Cabinet Office of Japan in 2018, 2019, and 2020.
We used individual data from the three independent “Surveys of Attitudes toward Food and Nutrition Education,” conducted by the Cabinet Office of Japan in 2018, 2019, and 2020 (S-2018, S-2019, and S-2020). The three surveys were performed in October 2018, November/December 2019, and December 2020. We used the data of S-2018-2019 and S-2020 as those before and during COVID-19 outbreak, respectively.
For each nationwide survey, a two-stage stratified random sampling was used to select 3,000 people aged 20 or older. The survey sample was representative of the Japanese population and accounted for regional differences across the country, and the number of people surveyed in each municipality was proportionate to the municipality’s population. Therefore, we assessed that the survey sample was appropriate to estimate SRH before and during COVID-19 outbreak. There were 1824, 1721, and 2395 participants for S-2018, S-2019, and S-2020, respectively. After removing missing data, 1823, 1709, and 2364 respondents provided adequate data for further analyses.
We used the following questions, all of which were the same for the S-2018, S-2019, and S-2020. SRH was assessed based on the question: “How would you rate your general health status?.” The responses were rated on a five-point Likert scale (“good,” “fairly good,” “neither good nor bad,” “fairly bad,” and “bad”). Subjective economic status (SES) was assessed based on the question: “How would you rate your economic status?.” The responses were rated on a five-point Likert scale (“good,” “fairly good,” “neither good nor bad,” “fairly bad,” and “bad”). Healthy behaviors for prevention of lifestyle diseases were assessed based on the question: “For the prevention and improvement of lifestyle diseases, to what extent do you behave? For example, weight management, reduced salt, and so on.” The responses were rated on a five-point Likert scale (“usually,” “often,” “rarely,” “never,” and “do not know”). Residential area was categorized into five city sizes: big city, medium-sized cities (cities with a population of 200,000 or more), medium-sized cities (cities with a population of 100,000 or more), small cities (cities with less than 100,000 inhabitants), and towns and villages.
To analyze the differences in the distribution of the items (gender, SRH, SES, healthy behaviors, and city size) among the S-2018, S-2019, and S-2020, the chi-square test was used. In addition, to analyze differences in SRH, SES, and healthy behaviors among S-2018, S-2019, and S-2020, nonparametric tests (the Kruskal-Wallis analysis and Bonferroni’s multiple comparison test) were conducted because the data were nonnormally distributed. Binomial logistic regression models were used to obtain odds ratios (OR) and their 95% confidence intervals for SES and healthy behaviors as predictors of SRH, after adjusting for age, gender, and residential areas.
All data were analyzed using SPSS version 28.0 (IBM Japan, Ltd., Tokyo, Japan), with a significance level of 0.05.
Ethics approval was not required for this secondary analysis of data publicly available through the University of Tokyo’s Center for Social Research and Data Archives, Institute of Social Science.
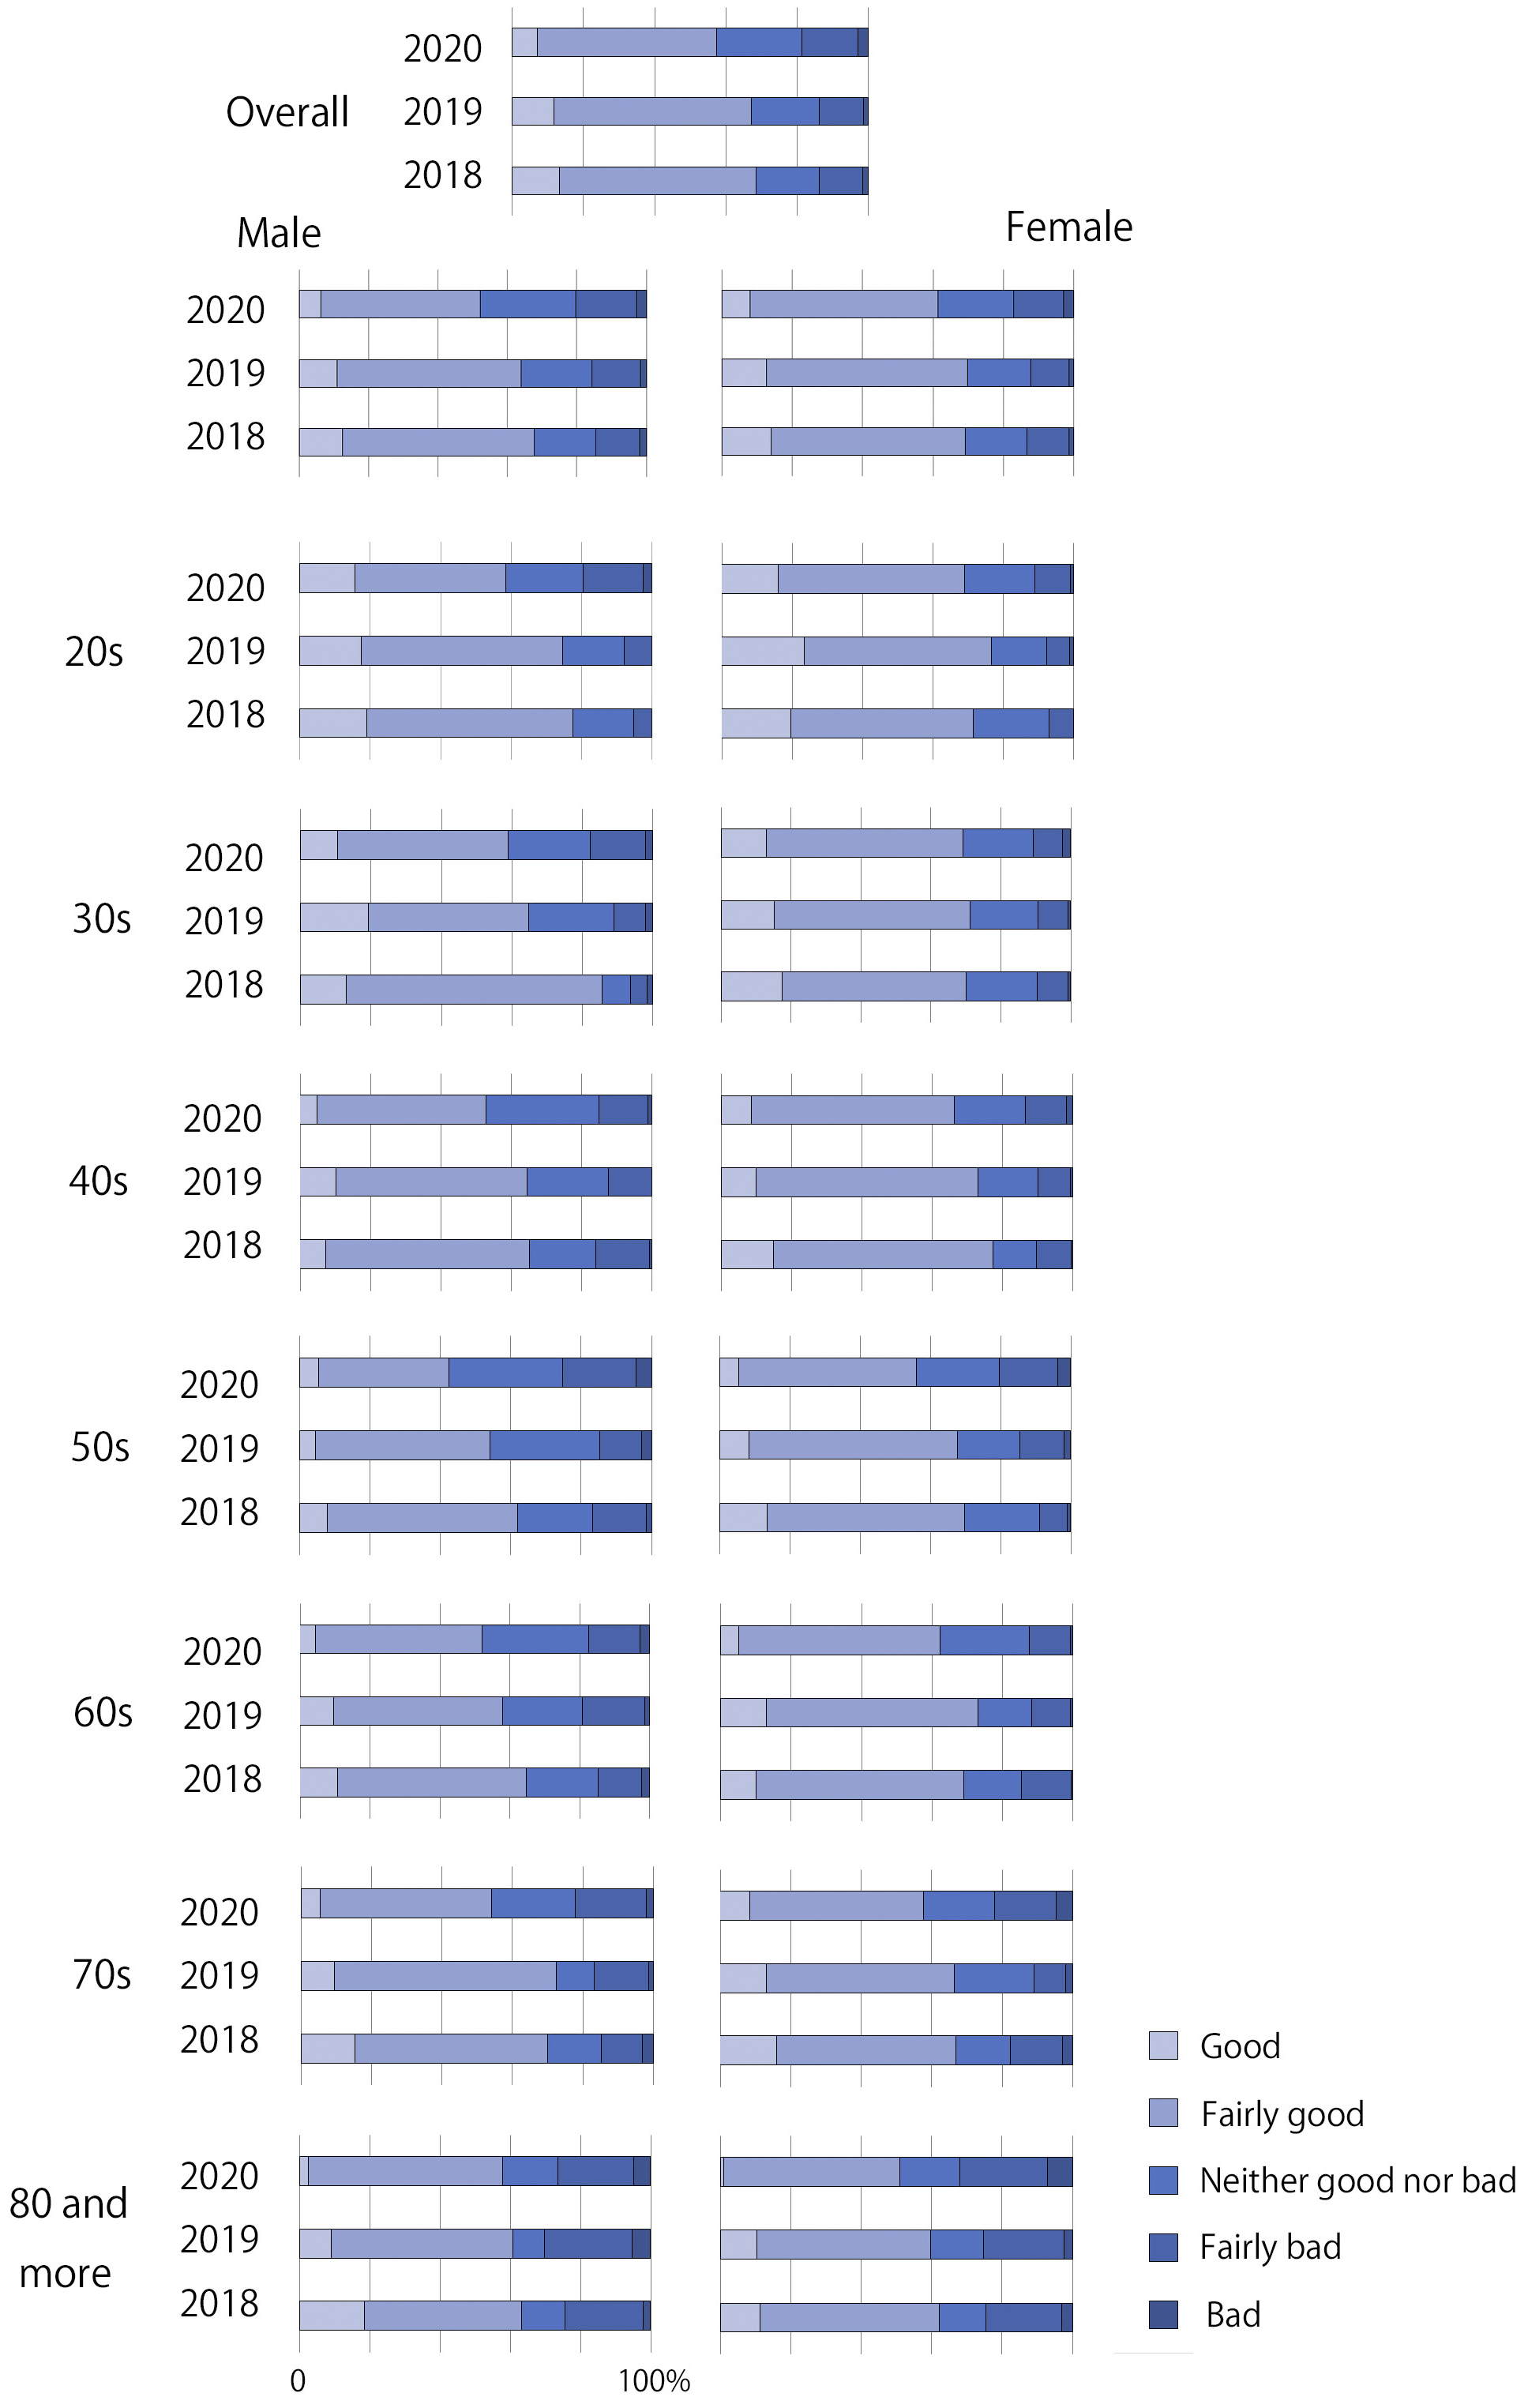
Table 1 presents the demographic characteristics of the participants of S-2018, S-2019, and S-2020. The mean age of the participants of S-2018, S-2019, and S-2020 was 56.8 ± 16.6, 56.1 ± 17.5, and 56.8 ± 17.1 years, respectively. The median age of those was 58, 57, and 58 years, respectively. Figure 1 shows the percentage of SRH category. In S-2020, the percentages of good/fairly good SRH decreased in both male and female in all ages compared with those in S-2018 and S-2019.
Table 1. Characteristics of Participants and Univariate Analysis.
| Variable | S-2018 | S-2019 | S-2020 | P1 | P2 | P3 | |||
|---|---|---|---|---|---|---|---|---|---|
| n, overall | 1824 | 1721 | 2395 | ||||||
| Age, mean SD | 56.8, 16.6 | 56.1, 17.5 | 56.8, 17.1 | ||||||
| n, male (%) | 799 | (42.8) | 759 | (44.1) | 1032 | (43.1) | 0.794 | ||
| n, female (%) | 1025 | (56.2) | 962 | (55.9) | 1363 | (56.9) | |||
| Self-rated health (SRH) (%) | |||||||||
| Very good | 242 | (13.3) | 201 | (11.8) | 169 | (7.1) | <0.001 | <0.001 | |
| Fairly good | 1007 | (55.2) | 948 | (55.5) | 1192 | (50.4) | S-2018 vs. S-2019: 0.926 | ||
| Neither good nor bad | 321 | (17.6) | 327 | (19.1) | 567 | (24.0) | S-2018 vs. S-2020: <0.001 | ||
| Fairly bad | 225 | (12.3) | 209 | (12.2) | 369 | (15.6) | S-2019 vs. S-2020: <0.001 | ||
| Bad | 28 | (1.5) | 24 | (1.4) | 67 | (2.8) | |||
| Subjective economic status (SES) (%) | |||||||||
| Very good | 190 | (10.4) | 236 | (13.8) | 202 | (8.5) | <0.001 | <0.001 | |
| Fairly good | 684 | (37.5) | 569 | (33.3) | 747 | (31.6) | S-2018 vs. S-2019: 0.855 | ||
| Neither good nor bad | 604 | (33.1) | 538 | (31.5) | 758 | (32.1) | S-2018 vs. S-2020: <0.001 | ||
| Fairly bad | 291 | (16.0) | 314 | (18.4) | 516 | (21.8) | S-2019 vs. S-2020: <0.001 | ||
| Bad | 54 | (3.0) | 52 | (3.0) | 141 | (6.0) | |||
| Healthy behaviors for preventing lifestyle-related diseases (%) | |||||||||
| Usually | 426 | (23.4) | 447 | (26.2) | 280 | (11.8) | <0.001 | <0.001 | |
| Often | 809 | (44.5) | 702 | (41.1) | 1248 | (52.8) | S-2018 vs. S-2019: 0.647 | ||
| Rarely | 503 | (27.6) | 448 | (26.2) | 767 | (32.4) | S-2018 vs. S-2020: <0.001 | ||
| Never | 79 | (4.3) | 107 | (6.3) | 69 | (2.9) | S-2019 vs. S-2020: <0.001 | ||
| Do not know | 6 | (0.3) | 5 | (0.3) | 0 | (0.0) | |||
| City size of living area | |||||||||
| Big cities | 90 | (4.9) | 93 | (5.4) | 153 | (6.5) | 0.409 | 0.136 | |
| Medium-sized cities (cities with a population of 200,000 or more) | 373 | (20.5) | 362 | (21.2) | 489 | (20.7) | |||
| Medium-sized cities (cities with a population of 100,000 or more) | 728 | (39.9) | 698 | (40.8) | 970 | (41.0) | |||
| Small cities (cities with less than 100,000 inhabitants) | 455 | (25.0) | 392 | (22.9) | 529 | (22.4) | |||
| Towns and villages | 177 | (9.7) | 164 | (9.6) | 223 | (9.4) | |||
| P1: χ2 test; P2: Kruskal-Wallis test; P3: Bonferroni’s multiple comparison test results | |||||||||
Nonparametric test results showed that the difference analysis of S-2018, S-2019, and S-2020 had statistical significance, with different internal differences (Table 1). The distributions of SRH, SES, and healthy behaviors in S-2020 significantly differed from those in S-2018 and S-2019. There was no significant difference in SRH, SES, and healthy behaviors between S-2018 and S-2019. The results indicated that the distributions of SRH, SES, and healthy behaviors became worse in 2020.
Table 2 shows the results of binomial logistic regression analyses of the factors associated with SRH. For binomial logistic regression analyses, SRH and SES were divided into two groups, “good/fairly good/neither good nor bad” and “fairly bad/bad,” and healthy behavior was divided into two groups, “always/often” and “rarely/never.” SES was significantly associated with SRH in S-2018, S-2019, and S-2020 after adjusting for age, gender, and resident city size. Adjusted OR was highest in S-2020, indicating that the association between SRH and SES became stronger during COVID-19 outbreak. The association between SRH and healthy behavior was significant in S-2018, S-2019, and S-2020 after adjusting for age, gender, and resident city size. Adjusted OR was highest in S-2020, suggesting that the association between SRH and healthy behaviors became remarkable during COVID-19 outbreak. In other words, people with healthy behaviors tended to keep good SRH during COVID-19 outbreak.
Table 2. The Results from Multivariable Analysis.
| Self-rated health (SRH) | ||||||||
|---|---|---|---|---|---|---|---|---|
| Variable/category | Good/fairly good/ neither good nor bad |
Fairly bad/bad | Crude OR | 95% CI | Adjusted OR | 95% CI | p-value | |
| Subjective economic status (SES) | ||||||||
| S-2018 | Good/fairly good/neither good nor bad | 1319 (72.4%) | 159 (8.7%) | 3.11 | 2.33-4.15 | 3.09 | 2.30-4.15 | <0.001 |
| Fairly bad/bad | 251 (13.8%) | 94 (5.2%) | 1.00 | 1.00 | ||||
| S-2019 | Good/fairly good/neither good nor poor | 1203 (70.4%) | 140 (8.2%) | 2.93 | 2.18-3.93 | 2.84 | 2.11-3.83 | <0.001 |
| Fairly bad/bad | 273 (16.0%) | 93 (5.4%) | 1.00 | 1.00 | ||||
| S-2020 | Good/fairly good/neither good nor poor | 1505 (63.7%) | 202 (8.5%) | 4.12 | 3.32-5.12 | 4.01 | 3.17-4.93 | <0.001 |
| Fairly bad/bad | 423 (17.9%) | 234 (9.9%) | 1.00 | 1.00 | ||||
| Healthy behaviors for preventing lifestyle-related diseases | ||||||||
| S-2018 | Always/often | 1080 (59.4%) | 155 (8.5%) | 1.40 | 1.06-1.83 | 1.56 | 1.16-2.10 | 0.003 |
| Rarely/never | 485 (26.7%) | 97 (5.3%) | 1.00 | 1.00 | ||||
| S-2019 | Always/often | 1004 (58.9%) | 145 (8.5%) | 1.29 | 0.97-1.72 | 1.39 | 1.02-1.89 | 0.035 |
| Rarely/never | 468 (27.5%) | 87 (5.1%) | 1.00 | 1.00 | ||||
| S-2020 | Always/often | 1301 (55.0%) | 227 (9.6%) | 1.91 | 1.55-2.36 | 2.01 | 1.56-2.48 | <0.001 |
| Rarely/never | 627 (26.5%) | 209 (8.8%) | 1.00 | 1.00 | ||||
| Adjusted model: age, gender, and city size of living area | ||||||||
This study examined the factors related to SRH before and during the spread of COVID-19. SRH became worse during COVID-19 outbreak (S-2020) with higher association with SES and healthy behavior compared with before the outbreak (S-2018 and S-2019). However, the main limitation of this study was that we used individual data from several cross-sectional surveys independently conducted before and during COVID-19 outbreak to measure the effects of the outbreak on SRH. Since the data used in the analysis were not longitudinal, but pooled data from each survey year, we could not reveal real causal relationship.
The association between health inequality and socioeconomic status is well documented across various context and population (6), (7). Japan currently shows one of the highest levels of average life expectancy in the world, as well as comparatively low levels of health inequality than other developed nations (8), (9). However, warning bells are sounding about health inequality due to economic inequality in Japan recently (10). It is suggested that people with bad SES due to financial and job losses are more vulnerable to the COVID-19 outbreak (11). Holding constant COVID-19-related stress and background controls at both individual and contextual (country) levels, higher income is positively associated with better subjective health (12). Under unprecedented situations, such as the COVID-19 outbreak, healthy behaviors based on higher health literacy could be helpful in achieving good SRH even though SES condition is relatively poor. It is necessary to consider strategies to promote health education to improve public health outcomes.
None
This work was supported by JSPS KAKENHI grant number JP22K02139.
The data for this secondary analysis, “Surveys of Attitudes toward Food and Nutrition Education,” conducted by the Cabinet Office and the Ministry of Agriculture, Forestry and Fisheries of Japan in 2018, 2019, and 2020 were provided by the Social Science Japan Data Archive, Center for Social Research and Data Archives, Institute of Social Science, The University of Tokyo.
HI: data analysis and manuscript writing; YI: project development, data management, data analysis, and manuscript writing/editing.
Kananen L, Enroth L, Raitanen J, et al. Self-rated health in individuals with and without disease is associated with multiple biomarkers representing multiple biological domains. Sci Rep. 2021;11(1):6139.
Jylhä M. What is self-rated health and why does it predict mortality? Towards a unified conceptual model. Soc Sci Med. 2009;69(3):307-16.
Wuorela M, Lavonius S, Salminen M, et al. Self-rated health and objective health status as predictors of all-cause mortality among older people: a prospective study with a 5-, 10-, and 27-year follow-up. BMC Geriatr. 2020;20(1):120.
Kopp M, Skrabski A, Réthelyi J, et al. Self-rated health, subjective social status, and middle-aged mortality in a changing society. Behav Med. 2004;30(2):65-70.
Kan C, Kawakami N, Karasawa M, et al. Psychological resources as mediators of the association between social class and health: comparative findings from Japan and the USA. Int J Behav Med. 2014;21(1):53-65.
Kondo N, Sembajwe G, Kawachi I, et al. Income inequality, mortality, and self rated health: meta-analysis of multilevel studies. BMJ. 2009;339:b4471.
Reche E, Konig HH, Hajek A. Income, self-rated health, and morbidity. A systematic review of longitudinal studies. Int J Environ Res Public Health. 2019;16(16):2884.
Takahashi Y, Fujiwara T, Nakayama T, et al. Subjective social status and trajectories of self-rated health status: a comparative analysis of Japan and the United States. J Public Health. 2018;40(4):713-20.
Hanibuchi T, Nakaya T, Murata C. Socio-economic status and self-rated health in East Asia: a comparison of China, Japan, South Korea and Taiwan. Eur J Public Health. 2012;22(1):47-52.
Kondo K. The society of health inequality. Igaku Shoin; 2022.
Geranios K, Kagabo R, Kim J. Impact of COVID-19 and socioeconomic status on delayed care and unemployment. Health Equity. 2022;6(1):91-7.
Kim HH, Kim HK. Income inequality, emotional anxiety, and self-rated health in times of the coronavirus pandemic: evidence from a cross-national survey. Res Soc Stratif Mobil. 2021;75:100640.